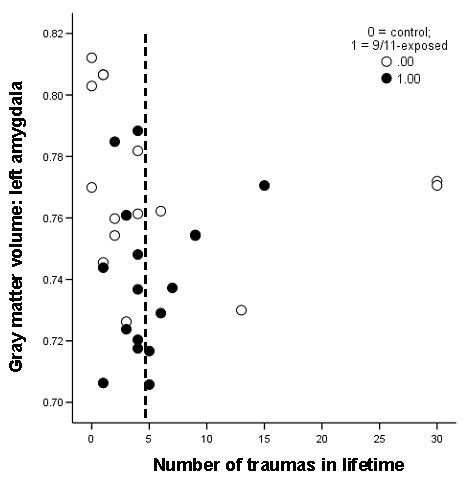
Figure 4.

The relationship between amygdala gray matter volume and number of traumas in lifetime. This relationship took the form of a first-order quadratic, such that for lower numbers of lifetime traumas amygdala gray matter volume decreased with increased trauma exposure and for high numbers (greater than 5) the relationship reversed. This relationship was evident in the entire group (β(number of traumas2) = 1.3, p = .03) as well as in the comparison group alone (β[number of traumas2] = 2.45, p = .02). The dotted line indicates the inflection point of the quadratic at 5 traumas in a lifetime. Open circles indicate comparison group; closed circles indicate 9/11-exposed.
