
Figure 3.
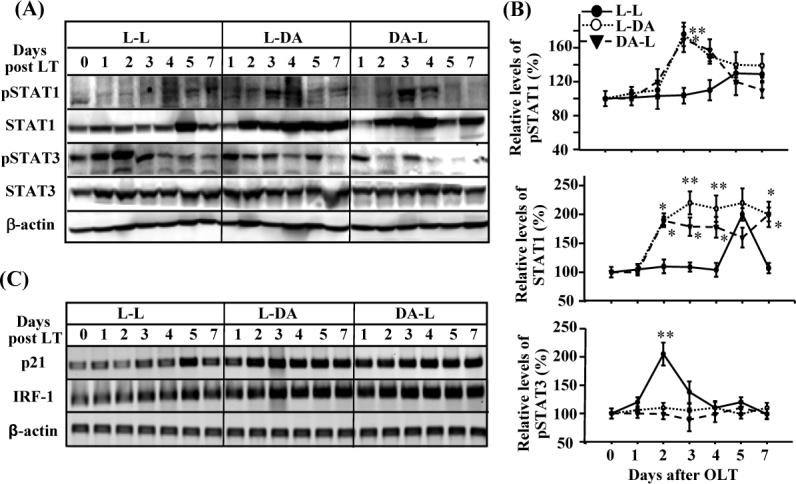
Upregulation of STAT1 activation and downregulation of STAT3 activation in the allogeneic grafts vs. the syngeneic grafts. The liver tissues from Fig. 1 were subject to Western blotting (A, B) and RT-PCR analyses (C). A representative of 3 experiments with similar results is shown. The band densities in panel A were quantified and the ratio of pSTAT1 (or STAT1, pSTAT3)/β actin mRNA were calculated. The ratios on day 0 were designated as 100%. Values are shown as means ± SEM (n=3−6 as described in Fig. 1). *P<0.05, **P<0.01 compared with values from corresponding L-L syngeneic grafts.