
Figure 4.
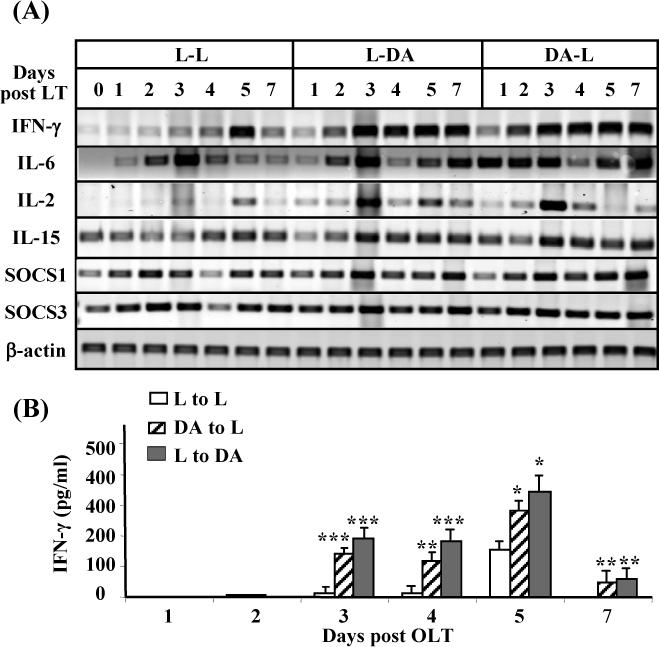
Upregulation of hepatic IFN-γ mRNA and serum IFN-γ levels in the allogeneic groups vs. the syngeneic groups. (A) The liver tissues from Fig. 1 were subject to RT-PCR analyses. A representative of 3 experiments with similar results is shown. (B) Sera from these transplanted rats were used for IFN-γ measurement. Values are shown as means ± SEM (n=3−6 as described in Fig. 1). *P<0.05, **P<0.01, ***P<0.001 compared with values from corresponding L-L syngeneic grafts.