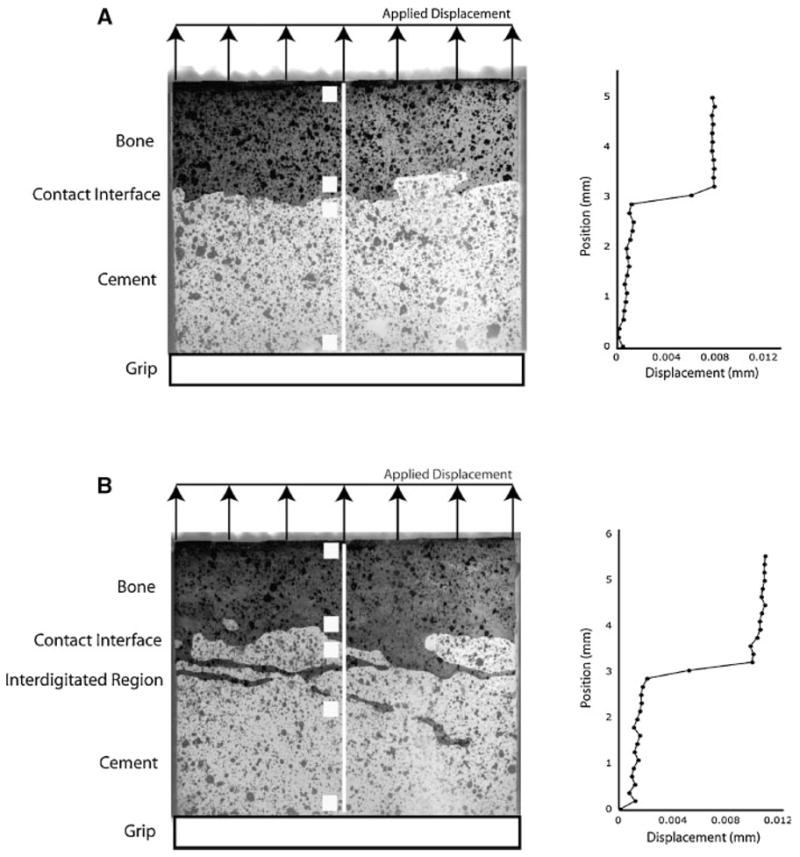
Figure 2.

Digital images of specimens with contact interface (A) and interdigitated/contact interface regions (B) along the midline of the cement–bone interface. Graphs to the right represent vertical displacement fields along the white center line of the respective specimens with specimens loaded in tension (vertical direction). Sampling areas for digital image correlation measurements are shown as white squares indicating regions that span displacement measurements for bone, contact interface, interdigitated region, and cement.
