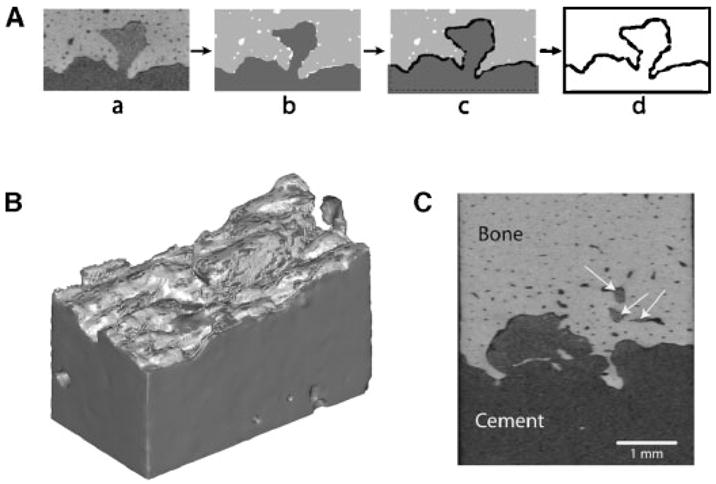
Figure 4.

Approach used to estimate contact area between cement and bone (A): the initial microCT scan set (a) was segmented into cement and bone (b), followed by a region growing operation of the cement (c), and calculation of the Boolean intersection between cement and bone (d). A 3D reconstruction (B) of the cement (dark gray) and region of intersection with bone (light gray). Also illustrated (C) are regions of cement flow into lacunar scale spaces in the cortical bone (arrows).
