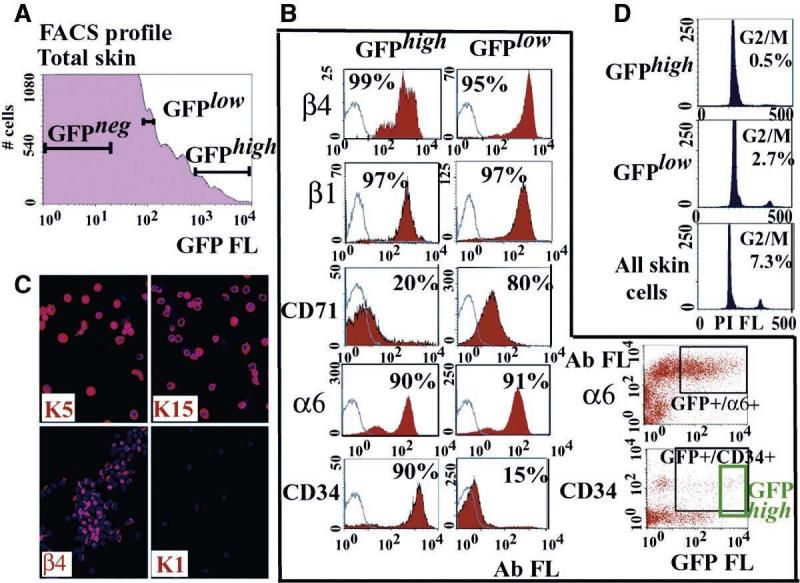
Fig. 2.

Isolation and preliminary characterization of bulge LRCs and progeny. Animals were Tet-fed for 4 weeks beginning at t = 4 weeks. (A) FACS analyses of single-cell suspensions of skins. GFP fluorescence (FL) is in arbitrary units. (B) Two-color FACS analyses for GFP and five surface markers. α6/CD34 data illustrate that GFPhigh LRCs represent only ∼30% of α6/CD34/K5-H2B-GFP–positive cells. White, without primary Abs; red, with Abs. Percentages of total cells scoring positive are indicated. (C) GFPhigh FACS population analyzed by immunofluorescence to illustrate homogeneity. Figure S4B provides quantification of all three fractions screened for six markers. (D) Propidium iodide (PI)–FACS cell cycle profiles by DNA content: G0/G1 (n = 1), G2/M (n = 2), and S (n = 1 or 2). Percentage of total cells in G2/M is indicated.
