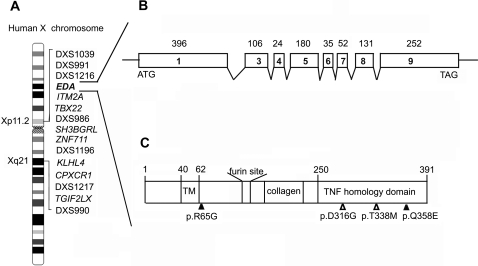
Figure 4. Candidate genes identified in the critical region in the Xp11-Xq 21.
(A). The gene order for this region as obtained from NCBI (NCBI Map Viewer, human Build 36.2). (B). The EDA gene structure. The numbered boxes represent exons and the connecting lines represent intronic regions. (C). The structural feature of protein product of EDA. The start and stop codons are indicated by “ATG” and “TAG.” The transmembrane domain (“TM”), furin recognition site, collagen domain, and the TNF homology domain are shown. The relative positions of the mutations identified in this article are indicated by open triangles. Mutations found in previous studies associated with X-linked hypodontia, are also indicated in this diagram by closed triangles.

