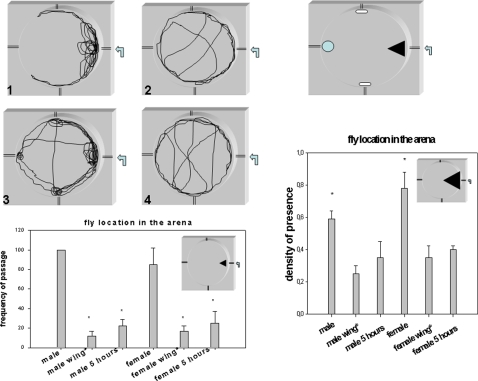
Figure 11. Exploration analysis of flies after unilateral lesion of the wing costal nerve and after emergence from pupa.
(1–4) Flies were placed individually in an arena designed so that they can walk but not fly. A source of odorants (ethanol/apple juice, 1/3) is injected by a push syringe at 1ml/min (arrow) and the exploration of flies is monitored by a camera connected to software to enable analysis. A typical representative trajectory is shown for female (1,2) and male flies (3,4) (5 day old) with (2,4)or without (1,3) an unilateral wing costal nerve lesion (lesion is indicated as male wing* and female wing* in graphs). Four “check point” landmarks were used for the counting of fly passages (see top right , black triangle, blue circle and white oblong shape). Bottom graph: comparative frequency of passages in the black triangle landmark. The time for 100 passages for a male was used a time period to count the passages on the others flies. Bars are the mean +/−SE Student t test analysis; *p<0.001, n = 10. Right graph: proportion of time spent in black triangle for the indicated flies. The experiment was carried out on a 15 minutes period and flies were tested one by one. Bars are the mean +/−SE *Student t test analysis; *p<0.001, n = 20. Five day old flies with or without a wing nerve lesion and 5 hour old young flies were tested as indicated in the graphs.

