
Fig 4. Blc2 expression, prevents apoptosis in MDCK cysts at high density, but has no effect at low density.
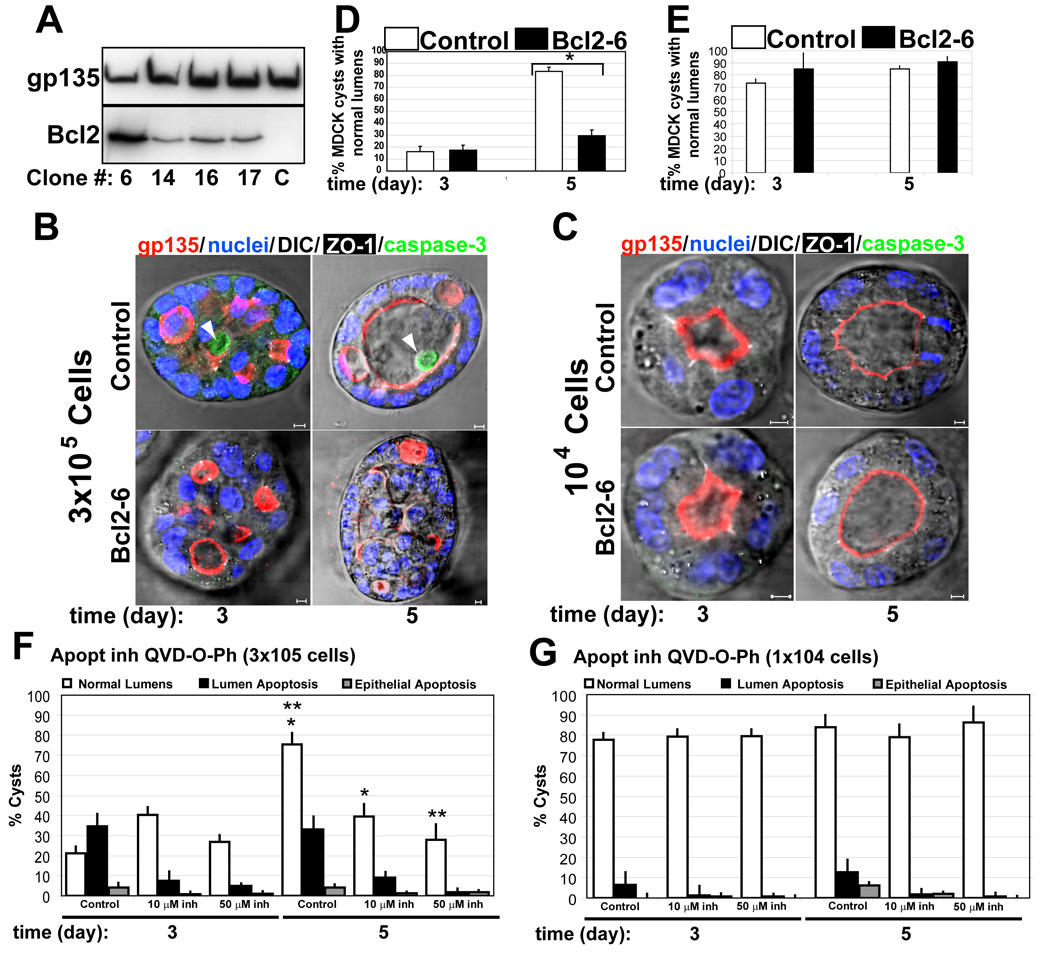
(A) Western blot of stable expression of Bcl2. Extracts from different clones of MDCK Bcl2 were inmunoblotted with gp135 (upper panel) as a control and anti-Bcl2 (lower panel) to detect endogenous and transfected proteins.
(B) Effect of Bcl2 expression on lumen formation and apoptosis in high density MDCK cells. MDCK cells expressing Bcl2 (lower panels) or not (upper panels) were plated at high density (3×10⁵ cell/ml) to form cysts for 3 and 5 days. Cells were fixed and stained to detect gp135 (red), caspase3 (green), ZO-1 (white) and nuclei (merged with DIC). Arrowheads indicate apoptotic cells in the lumen of the cysts. Scale bars 5 µm.
(C) Effect of Bcl2 expression on lumen formation and apoptosis in low density. MDCK cells expressing Bcl2 (lower panels) or not (upper panels) were plated at low density (104 cell/ml) to form cysts for 3 or 5 days. Cells were visualized as in panel B. Scale bars 5 µm.
(D) Quantitation of cysts with normal lumens in high density MDCK cells transfected with Bcl2 (black bars) or control (white bars). Values shown are mean ±SD from 4 different experiments. * P <0.01
(E) Quantitation of cysts with normal lumens in low density MDCK cells transfected with Bcl2 (black bars) or control (white bars). Values shown are mean ±SD from 4 different experiments.
(F) Quantitation of cysts with normal lumens (white bars) in high density MDCK cells treated with Q-VD-OPh at different concentrations: control (0) 10µM and 50µM. Apoptosis in luminal (black bars) and epithelial cells (grey bars) were also quantified. Values shown are mean ±SD from 2 different experiments. *P<0.005; **P<0.005
(G) Quantitation of cysts with normal lumens (white bars) in low density MDCK cells treated with Q-VD-OPh at different concentrations control (0), 10µM and 50µM. Apoptosis in luminal (black bars) and epithelial cells (grey bars) were also quantified. Values shown are mean ±SD from 2 different experiments