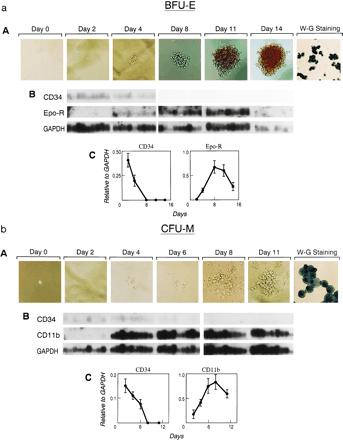
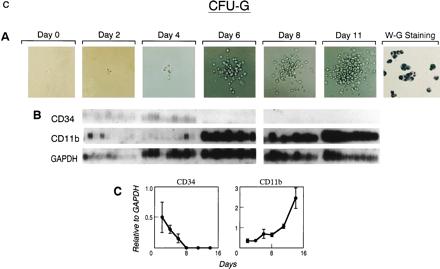
Figure 3.


Defining the pattern of marker gene expression during the differentiation of a BFU-E (a), CFU-M (b), or CFU-G (c) from a single CD34+,CD38− progenitor cell. Individual cells were flow-cytometrically sorted, cultured under the stated conditions, and sequentially photomicrographed (A) at indicated time points. Single cells harvested from the emerging colony depicted or colonies of identical morphology were analyzed by RT-PCR and Southern blotting after hybridization of independent filters from the same RT-PCR to the indicated cDNA probes (B). Quantitative PhosphorImager analysis of the indicated probes was normalized to GAPDH signals and used to derive mean and standard error values for each time point plotted in the graph (C).
