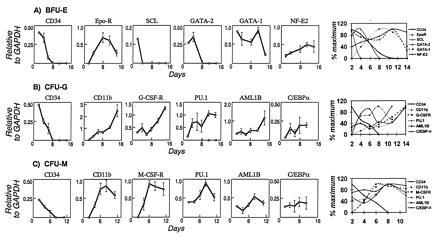
Figure 4.

Quantitative portrayal of the expression of indicated marker and regulatory genes during the differentiation of individual CD34+,CD38− cells into either BFU-E (A), CFU-M (B), or CFU-G (C). Each data point shown represents the mean and standard error for up to nine individual cells isolated from the same emerging colony at the indicated time points. Earlier time points had fewer input cells due to small colony size. Hybridizations for each transcript indicated were performed on Southern blots generated from a single RT-PCR for each cell sample. Independent colonies of identical morphologic type yielded comparable patterns of gene expression. The last graph in each row represents the superimposition of the data normalized to maximal expression level and represented as curves.
