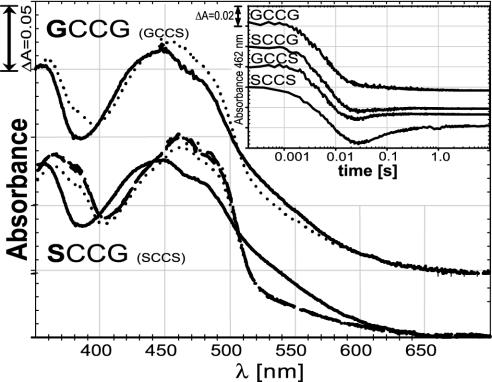
Fig. 2.
Half-reactions of wild-type enzyme and mutant forms. Each protein was reduced with sodium borohydride. Reduced protein was mixed in the stopped-flow spectrophotometer with various concentrations of oxidized DmTrx. Solid lines represent the reduced enzyme species with no Trx added. Dotted spectra depict the enzyme species after addition of two equivalents of oxidized Trx. In the SCCG case, the dashed line represents three equivalents of Trx, and the dash-dotted line represents five equivalents. For clarity, the spectra of GCCG are shifted by 0.05 units. The absorbance of the GCCS mutant was essentially identical to that of GCCG, whereas the SCCS mutant had essentially the same absorbance as SCCG (data not shown). (Inset) The reductive half-reaction of wild-type enzyme (SCCS) compared with three mutant forms (GCCG, SCCG, and GCCS). The protein was mixed in a stopped-flow spectrophotometer with four equivalents of NADPH per subunit, and the change in absorbance at 462 nm, representing the redox state of the flavin, was recorded over time. All enzymes were used at similar concentrations (≈18 μM subunits). The absorption starting point (0.2) was shifted for the GCCS, SCCG, and GCCG mutants for clarity. Note that the time axis is in logarithmic scale. See text for details.

