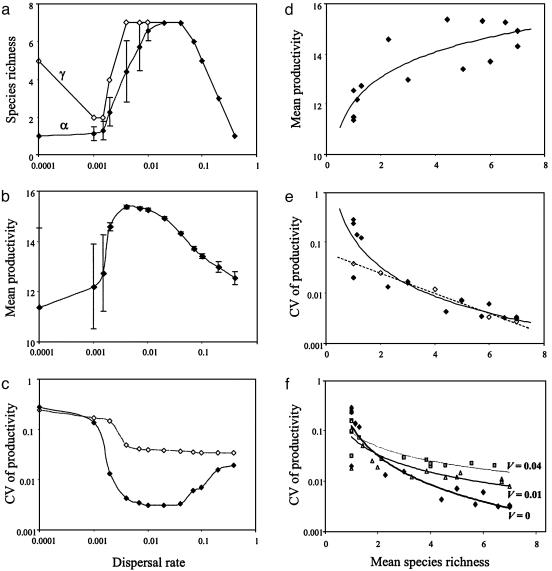
Fig. 3.
Regional (γ) and mean local (α) species richness (a), temporal mean of ecosystem productivity (b), and coefficient of variation (CV) of ecosystem productivity through time (c) as functions of dispersal rate (mean ± SD across communities), and the resulting relationships between the temporal mean of ecosystem productivity (d) or the CV of ecosystem productivity (e and f) and mean local species richness. In d, the curve fitted to the data is a logarithmic function (r2 = 0.71). In c and e, filled diamonds correspond to the original model in which both dispersal rate and species diversity are allowed to vary. In c, open diamonds show the results for the case in which the dispersal rate varies while local species richness is held constant at a single species (species 1). In e, open diamonds show the results for the case in which local species richness varies while the dispersal rate is held constant at an intermediate value (a = 0.02). In this scenario, species richness was varied by removing species sequentially from species 7 to species 2. The curves fitted to the data are a power function for filled diamonds (solid line, r2 = 0.84) and an exponential function for open diamonds (dotted line, r2 = 0.98). In f, a normally distributed random deviate with zero mean and variance (V) has been superimposed onto the periodic environmental fluctuations Ej(t) at each time step. Filled diamonds, V = 0 (no noise); open triangles, V = 0.01; gray squares, V = 0.04.

