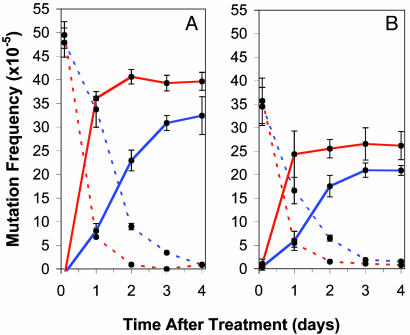
Fig. 3.
The kinetics of repair and mutation in p53-proficient (blue) and -deficient (red) mouse cells. The frequency (±SD) of mosaic (broken line) and homogenous (solid line) mutant plaques generated from DNA isolated from proliferating cells (A) and arrested cells induced to proliferate after mutagen treatment (B). All trials were performed in two separately derived cell strains for each genotype. The mean mutation and adduct frequencies were generated from data accumulated from four independently conducted experiments in each cell strain.

