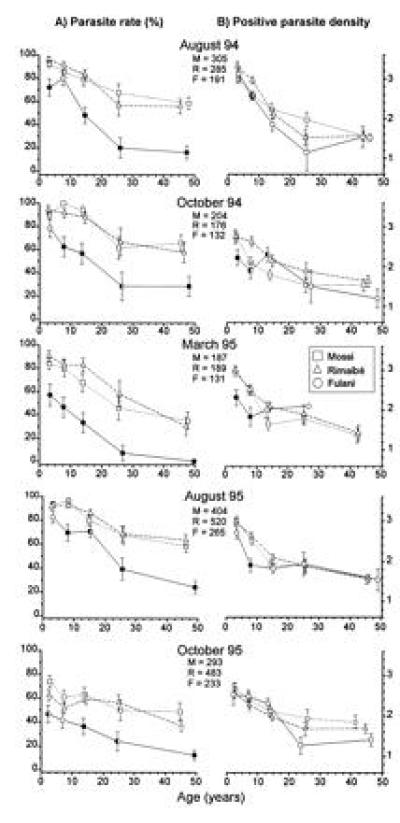
Figure 3.

Values ± standard errors, by age and ethnic group, of P. falciparum parasite rate (A) and log10 of positive parasite density (B) in the Barkoundouba area, Burkina Faso. The positions of the symbols on the x-axis correspond to the mean age for each of the following age groups: 0–5, 6–10, 11–20, 21–30, and >30 years. Data refer to five cross-sectional surveys (August 1994, October 1994, March 1995, August 1995, and October 1995). To indicate a significant difference between the Fulani and one or both the other two groups, we used a half-filled or filled symbols, respectively. The sample sizes of each survey are shown under the respective month. M, Mossi; R, Rimaibé; and F, Fulani.
