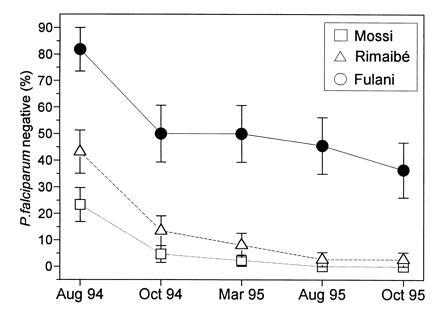
Figure 4.

Comparative analysis in three sympatric ethnic groups of the percentage (± SE) of negative individuals at the first examination (August 1994) and rate of persistence of their negativity in the successive cross-sectional surveys. Only individuals more than 10 years old and examined in all five surveys of Fig. 1 are considered. No significant difference of mean age was observed among the three subsamples. The comparison does not include the 0–10 year age groups, since their negativity rates were too low for this type of analysis. All the Fulani/Mossi and Fulani/Rimaibé comparisons are statistically significant with P < 0.01.
