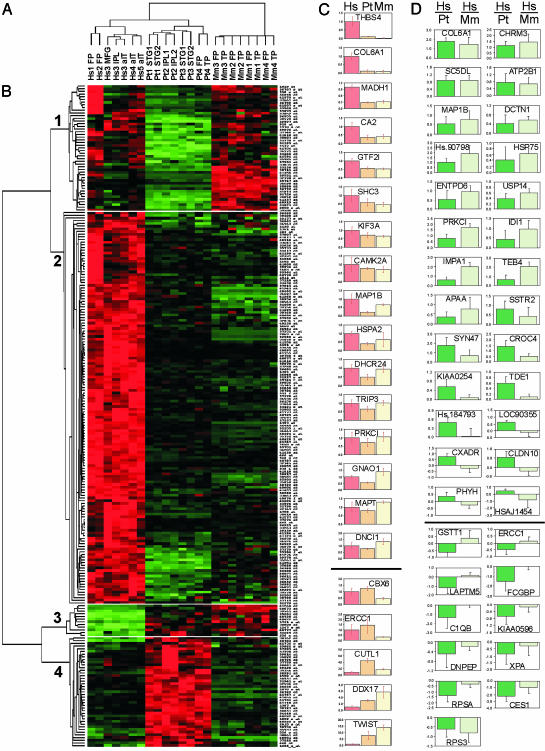
Fig. 1.
Gene expression analysis of human, chimpanzee, and rhesus macaque cerebral cortex. (A) Dendrogram showing the hierarchical clustering of the different cortex samples according to the hybridization signals of 9,733 probe sets detected in at least one of the samples from any species (Hs1–5, humans; Pt1–4, chimpanzees; Mm1–4, rhesus macaques). FP, frontal pole; MFG, medial frontal gyrus; IPL, inferior parietal lobule; aIT, anterior inferotemporal cortex; STG, superior temporal gyrus; TP, temporal pole. (B) Hybridization levels for 246 probe sets that show differences in signal intensity between human and chimpanzee cortex. Columns correspond to the different cortex samples in the same order as in the dendrogram. Rows represent the individual probe sets with their identifying number indicated (Right) (see Table 2). For each probe set, red, green, and black indicate increased, decreased, and equal hybridization levels relative to the median, respectively. Hierarchical cluster analysis classified the probe sets into four different groups related to their species-specific hybridization pattern. (C) Expression levels of 21 genes showing differences between humans and chimpanzees by real-time RT-PCR. The y axis corresponds to the average expression level in three chimpanzees (Pt, orange) and three rhesus macaques (Mm, yellow) relative to three humans (Hs, red). Standard deviation within each species is indicated by error bars. (D) Relative hybridization levels in human and non-human primate cortex samples of 37 genes interrogated by using cDNA arrays. The y axis represents the base-2 logarithm of the average hybridization signal ratio of four human–chimpanzee comparisons (Hs/Pt, dark green) and four human–rhesus comparisons (Hs/Mm, light green). Positive and negative values denote higher and lower hybridization levels, respectively, in humans than in non-human primates. In C and D, horizontal lines separate the genes that show increased expression in humans and in chimpanzees. The gene symbol or UniGene accession number is indicated inside each graph.

