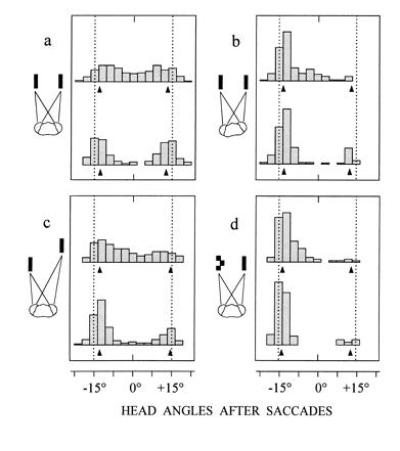
Figure 2.

Binocular fixation behavior in the presence of paired targets. Plots of distributions of fixation positions after the first (upper histograms) and the second saccade (lower histograms) of visual tracking. Targets are separated by 30° (dotted lines). With one exception the viewing distance of the display at the horizon is 40 mm. (a) Two identical (simple) targets with the head pointing midway prior to tracking (n = 524 saccades from 9 mantids). (b) Same stimulus conditions as in a, but the head points 6° ± 1.5° to the left prior to tracking (n = 232 saccades from 5 mantids). (c) Left target is within and right target is outside the catching range (40 mm and 140 mm, respectively), but both are equal in angular size and angular elevation when moving downwards (n = 476 saccades from 10 mantids). (d) Left target is complex and right target is simple (n = 298 saccades from 6 mantids). Note that head saccades in all four situations undershoot targets. This also holds true, when only the left or the right target is presented. Arrows at bottom of histograms show mean head angles of such trials.
