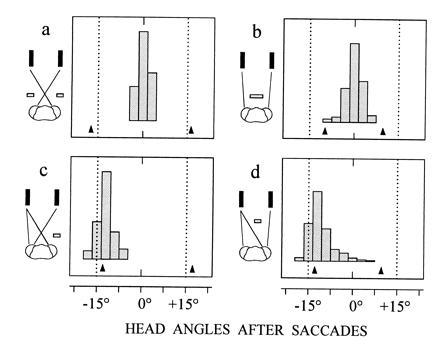
Figure 3.

Occlusion experiments to demonstrate the role of disparity in target selection. Same target constellation and viewing conditions as in Fig. 2a, but only the first saccade of visual tracking is considered. The viewing distance of the display is 40 mm (middle of the catching zone). Targets are presented to nine mantids and occluders are placed to mask the lateral eye regions in a (n = 105 saccades), the medial regions in b (n = 136 saccades), the lateral region of the right eye in c (n = 145 saccades), and the medial region of the left eye in d (n = 391 saccades). Arrows at bottom of histograms show mean head angles when only the left or the right target is presented.
