Figure 5.

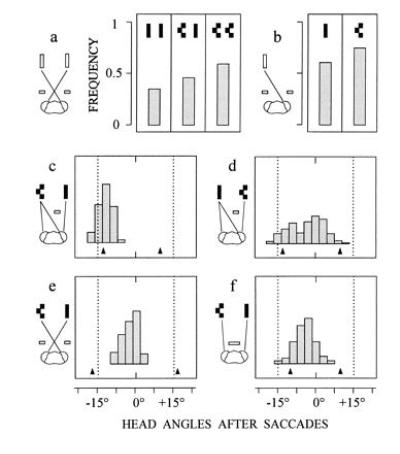
Occlusion experiments to demonstrate the interplay between monocular and binocular retinal cues. In a, occluders are placed to mask the lateral eye regions. Three different constellations of simple and complex targets are presented. Columns represent the frequency of the occurrence of one or several saccades when targets move downwards (n = 445 trials from five mantids). In b, occluders are arranged as in a, but only one target (simple or complex) is presented (n = 225 trials from the same mantids as in a). In c (n = 144 saccades from four mantids) and in d (n = 314 saccades from seven mantids), the situation is as in Fig. 3d except that either the left or the right target is complex. In e (n = 96 saccades from four mantids) and in f (n = 212 saccades from five mantids), the situation is as in Fig. 3 a and b, except that the left target is complex. Arrows at bottoms of histograms in c–f show mean head angles when only the left or the right target is presented.
