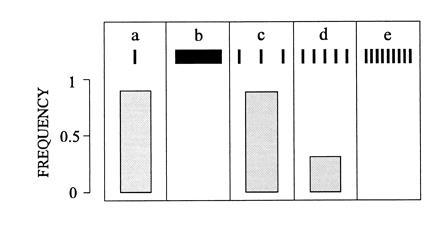
Figure 6.

Spatial limits of target separation. Mantids are presented with a single target in a and b and with three, five, and nine targets in c–e, respectively. Target constellations in c–e subtend the same 70° horizontal visual angle as the single target in b. Columns represent the frequency of the occurrence of one or several saccades when targets move downwards through the mantid’s binocular field of view (n = 367 trials from seven mantids). No saccades occur in b (because the size of the target exceeds those of typical prey) and in e where neighboring targets are 9° apart.
