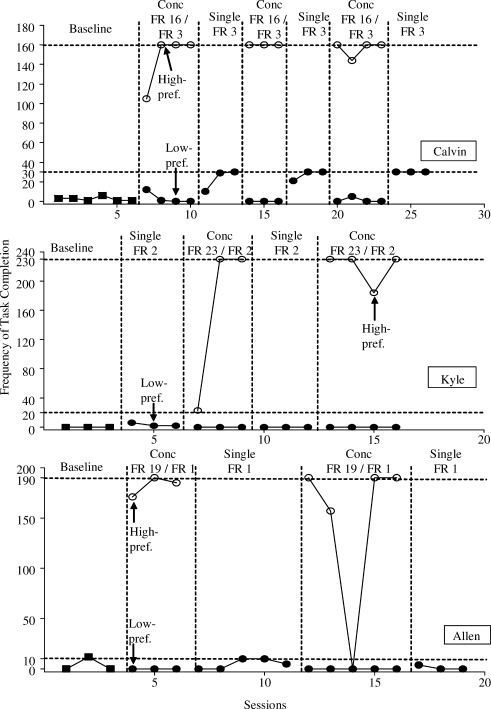
Figure 2.
Frequency of task completion during the single and concurrent FR analysis for Calvin (top), Kyle (middle), and Allen (bottom). The upper horizontal dashed lines indicate the maximum number of tasks that could be completed under the FR values for the HP stimulus. The lower horizontal dashed lines indicate the maximum number of tasks that could be completed under the FR values for the LP stimulus.

