
Fig. 2.
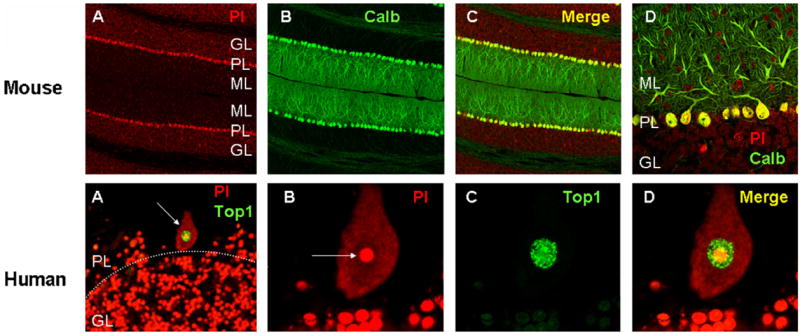
Purkinje neurons in the mouse and human cerebellum. (Top row) (A–C) Sections through the mouse cerebellum stained with propidium iodide (PI), a nucleic acid stain, illustrating the different layers of the cerebellar cortex; ML, molecular layer; PL, Purkinje layer; GL, granule layer. (B) Same section stained with calbindin (Calb), a marker for Purkinje neurons. Panel (C) is a merged image of (A) and (B). Panel (D) is a detail from (C) to illustrate the dendritic trees of the Purkinje neurons. (Bottom row) (A) low-power image of a section through the human cerebellum (case 1465, see [35]) showing a single Purkinje neuron (arrow), adjacent to the granule layer. Note the quantitative difference between the granule neurons (in the GL, below the dotted line) relative to the single Purkinje neuron. Green staining is topoisomerase I (Top1), counterstained with PI. (B–D) Higher magnification of the Purkinje neuron shown in (A), stained with PI (B), Top1 (C) and a merged image (D). In (B), note that the nucleolus of the Purkinje neuron (arrow) is comparable in size to the entire nucleus of the granule neurons shown below. Also note the much greater intensity for Top1 staining in the nucleus of the Purkinje neuron compared to the granule neurons. For further information, see [35]. Images produced by Tracy Gilman (mouse) and Sarah Calkins (human). The conditions used for PI staining and image acquisition were substantially different between the mouse and human material, and therefore the mouse and human images are not directly comparable with each other.