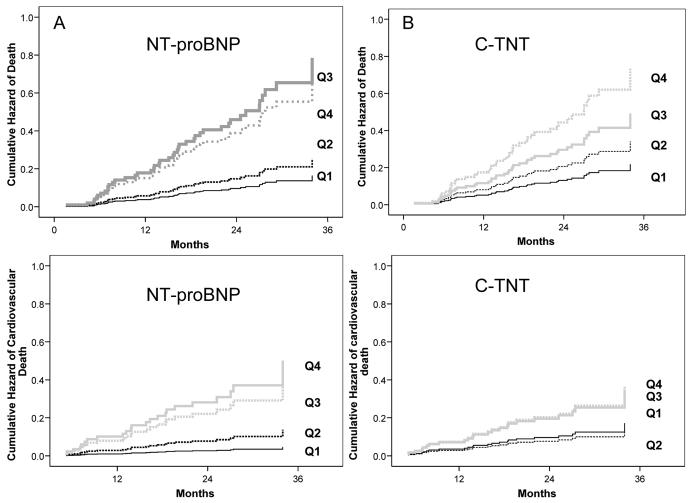
Figure 2.
Figure 2a - Adjusted cumulative hazard curves for quartiles of NT-proBNP for all-cause and cardiovascular mortality. Covariates adjusted for were age, race, gender, serum albumin, and ESRD etiology (diabetes vs non-diabetes) plotted at their mean values. NT-proBNP had a strong graded relationship with all-cause and cardiovascular mortality.
Figure 2b - Adjusted cumulative hazard curves for quartiles of cTnT for all-cause and cardiovascular mortality. Covariates adjusted for were age, race, gender, serum albumin, and ESRD etiology (diabetes vs non-diabetes) plotted at their mean values. cTnT had a strong graded relationship with all-cause mortality, but a weaker relationship with cardiovascular mortality.

