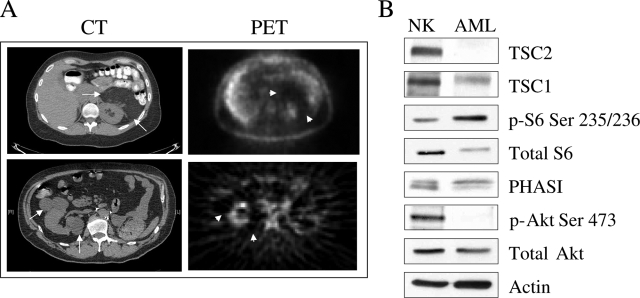
Figure 7.
mTOR activation is associated with low FDG-uptake in human AML. A: Paired computerized tomography and PET images of renal AMLs from cases #3 (top) and #2 (bottom). Arrows indicate masses representing AMLs on computerized tomography, and arrowheads show corresponding areas on FDG-PET. Background FDG activities are seen within the normal kidneys as it is being secreted in the urine. B: Western blot of renal angiomyolipoma from case #3 showing expression of TSC1, TSC2, phospho-S6, total S6, PHASI, phospho-Akt, total Akt, and actin.

