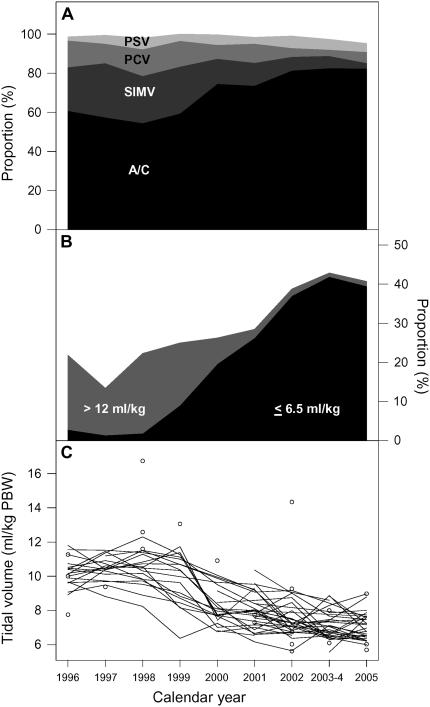
Figure 1.
Serial trends in preenrollment modes of ventilation and in preenrollment tidal volumes at ARDS (Acute Respiratory Distress Syndrome) Network hospitals, 1996–2005. (A) Preenrollment ventilator modes used over time. Each shade of gray represents a different ventilator mode (A/C = assist-control, SIMV = synchronized-intermittent mandatory ventilation, PCV = pressure support ventilation, and PSV = pressure support ventilation. Other modes of ventilation are not included in this panel). The x axis represents calendar year from 1996 to 2005, and the y axis represents the proportion for each ventilator mode. (B) Categories of preenrollment tidal volumes of greater than 12 ml/kg of predicted body weight (PBW) and 6.5 ml/kg PBW or less. This panel shows the proportion of patients with preenrollment tidal volumes of greater than 12 ml/kg of PBW and less than or equal to 6.5 ml/kg PBW. Data for patients with preenrollment tidal volumes of 6.51–12 ml/kg PBW are not shown, but the sum of proportions for each year adds up to 100%. (C) Mean preenrollment tidal volume over time by hospital where each line represents data from one hospital. The circles represent tidal volume of hospitals that only contributed one patient in a particular year.

