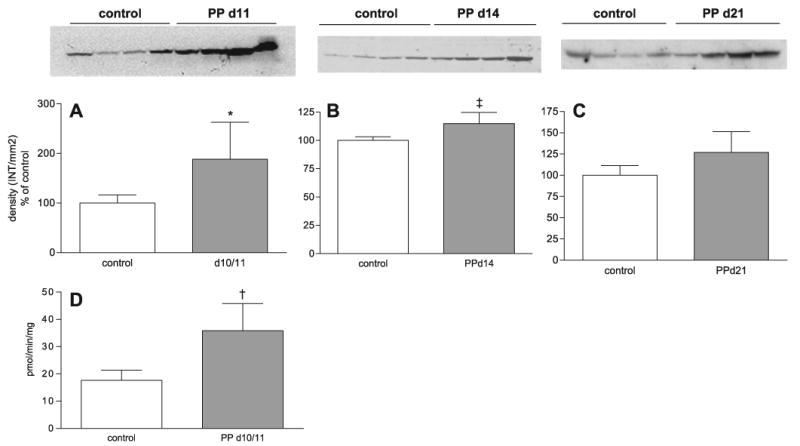
Fig. 3.

Cyp7a1 protein and hydroxylase activity are increased at 16 h in PP day 10/11 in 14 rats. Microsomal proteins were harvested from control or PP day 10/11, 14, and 21 rats killed at 16 h. Western blot analysis of Cyp7a1 protein expression in control and PP day 10/11 (*P < 0.005, PP day 10/11 vs. control rats) (A), PP day 14 (‡P < 0.05, PP day 14 vs. control rats) (B), and PP day 21 (C) rats. D: Cyp7a1 hydroxylase activity in control and PP day 10/11 rats. †P < 0.01, PP day 10/11 vs. control rats, determined by Student's t-test. A–C: densitometric analysis of Cyp7a1 Western blots (n = 4 animals per group). A–D: each bar represents the mean ± SD. For Western blot analysis, Ponceau red staining was performed for each membrane to ensure equal loading in each lane. INT, intensity.
