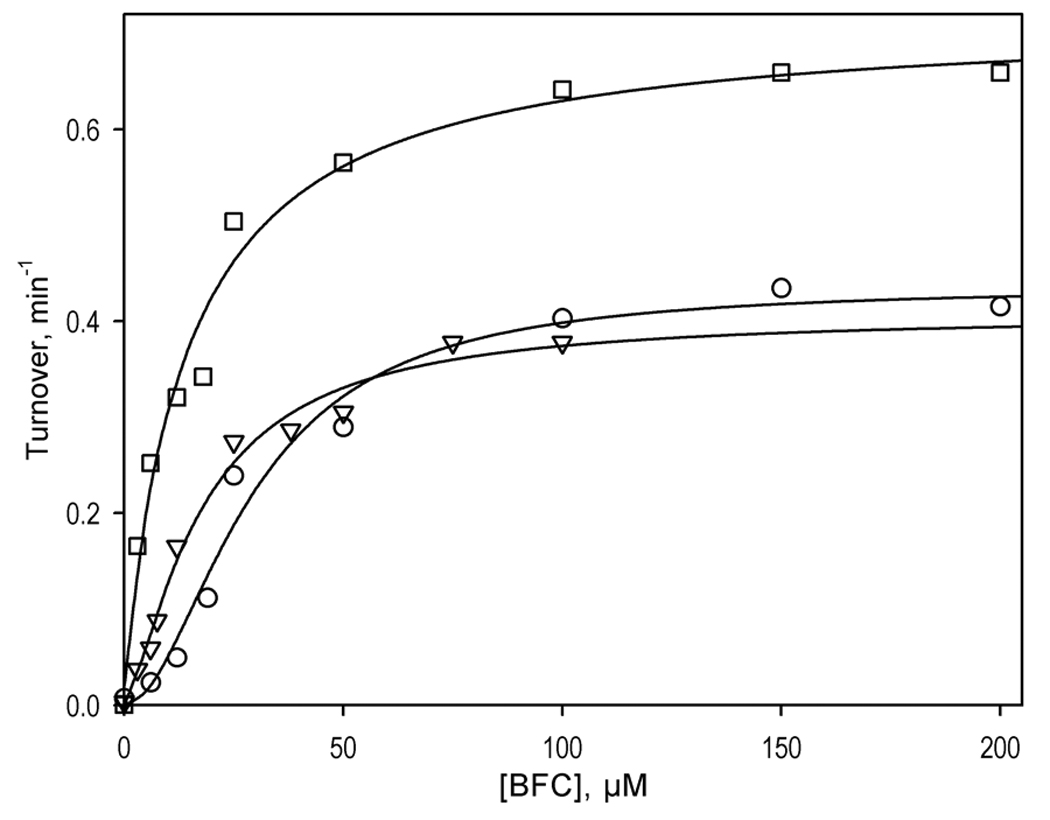
Figure 2.

Effect of ANF on O-debenzylation of 7-BFC by human liver microsomes and effect of GSH. The titration curve obtained at no effector added is shown with circles, while the data obtained at 25 µM ANF in the absence or in the presence of 1mM GSH are represented by triangles and squares, respectively. Solid lines represent the results of the fitting of the data sets to the Hill equation.
