Figure 3.


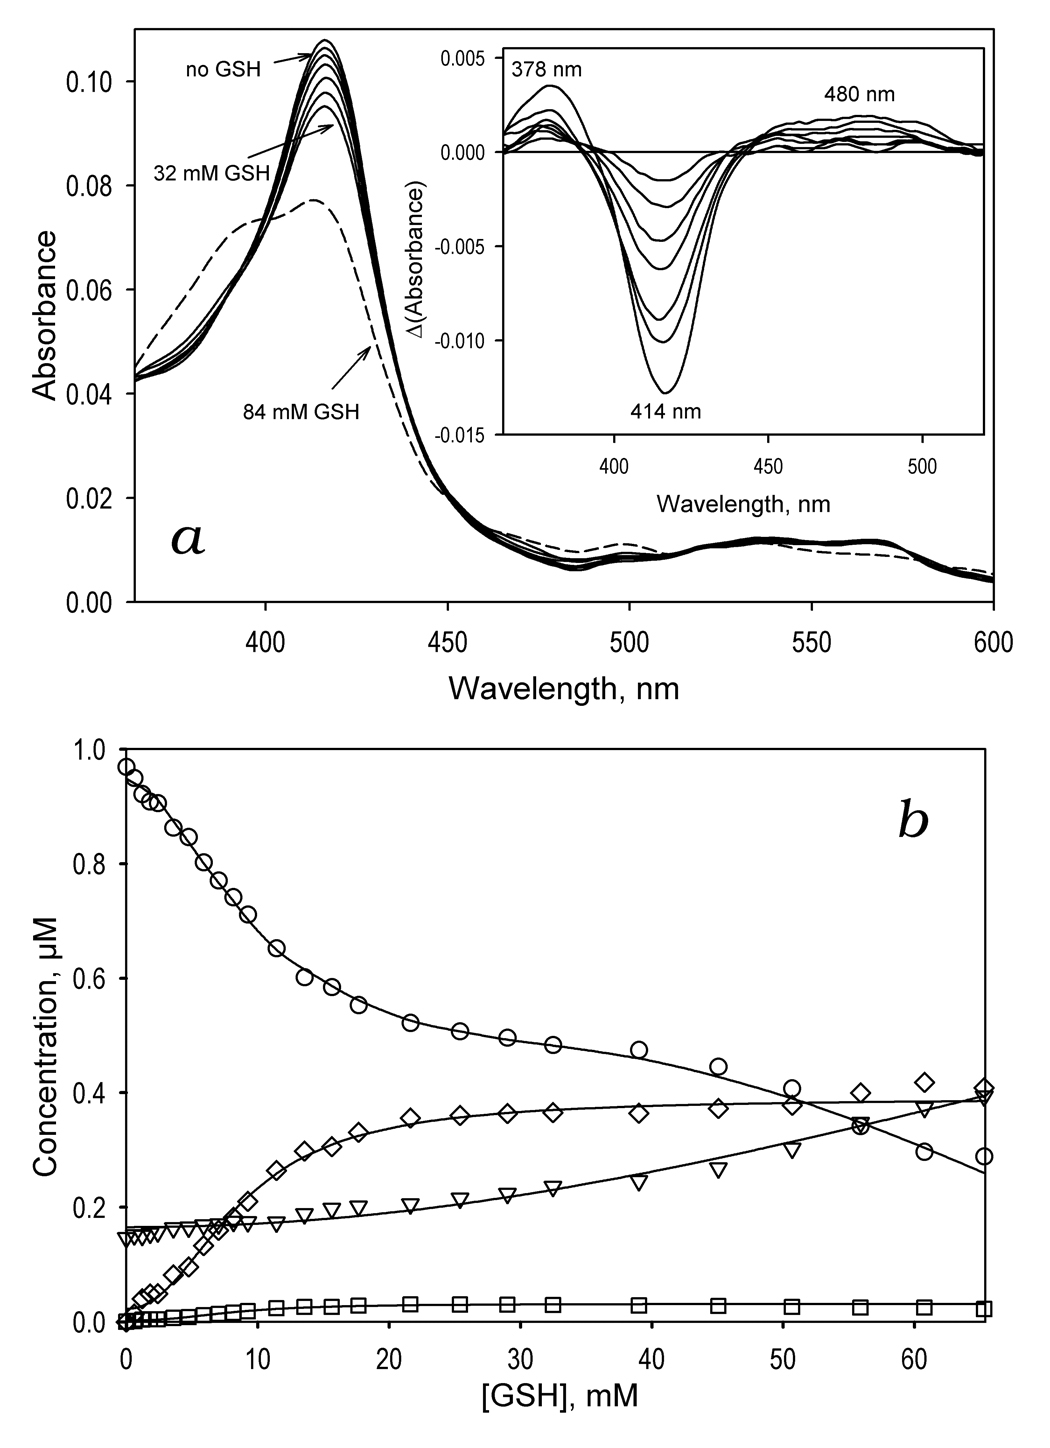
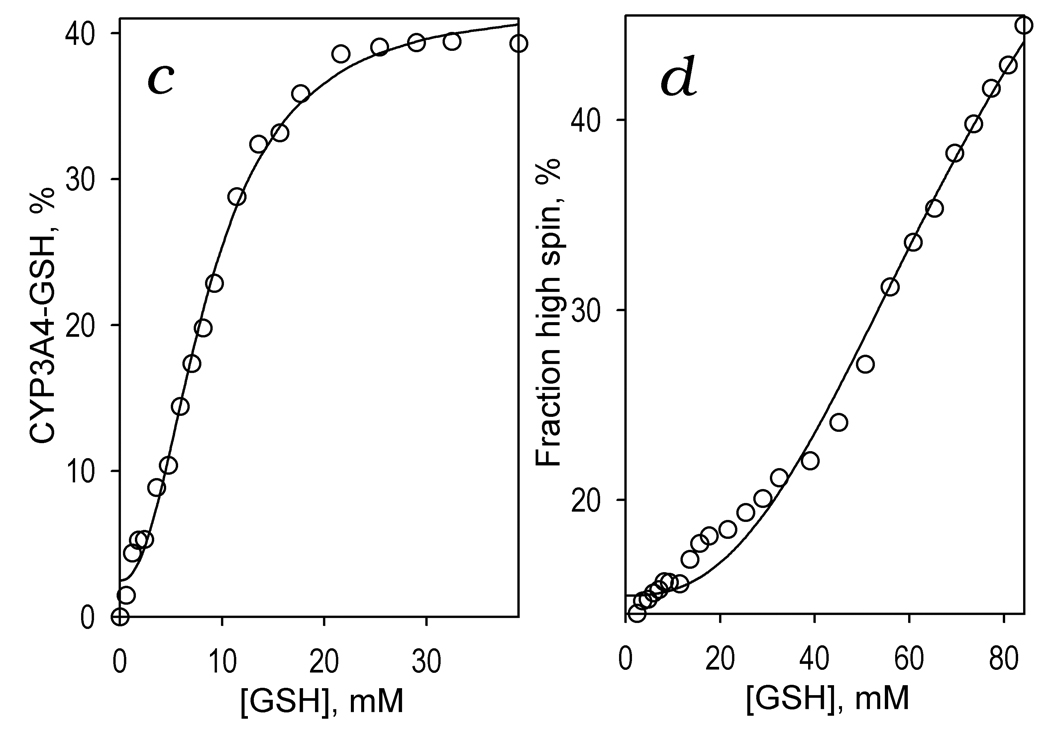
GSH-induced spectral transitions in CYP3A4 in solution. Panel a shows a series of spectra of 1 µM CYP3A4 in 0.1 M Na-Hepes buffer, pH 7.4 (25 °C) recorded at no GSH added and in the presence of GSH at the concentrations of 1.8, 4.7, 8.1, 14, 22, 32 mM (solid lines) and 84 mM (dashed line). The inset shows the difference spectra obtained by subtraction of the first spectrum of the series (no GSH added) from all subsequent spectra. Panel b illustrates the GSH-induced changes in the concentrations of the water-coordinated low spin (circles), pentacoordinated high-spin (inverted triangles), thiolate- (squares) and thiol-coordinated (diamonds) states of the heme protein. The changes in the fraction of the enzyme represented by the total of its thiolate- and thiol-coordinated states are shown in panel c. Here the solid line represent the results of the fitting of the data set by the Hill equation (S50 = 8.6 mM, n = 2.2, ΔFmax = 40 %). Changes in the high-spin fraction of the enzyme are illustrated in panel d, where the line represent the results of the fitting of the data set by the Hill equation (S50 = 76.5 mM, n = 2.5, ΔFmax = 50.5 %).
