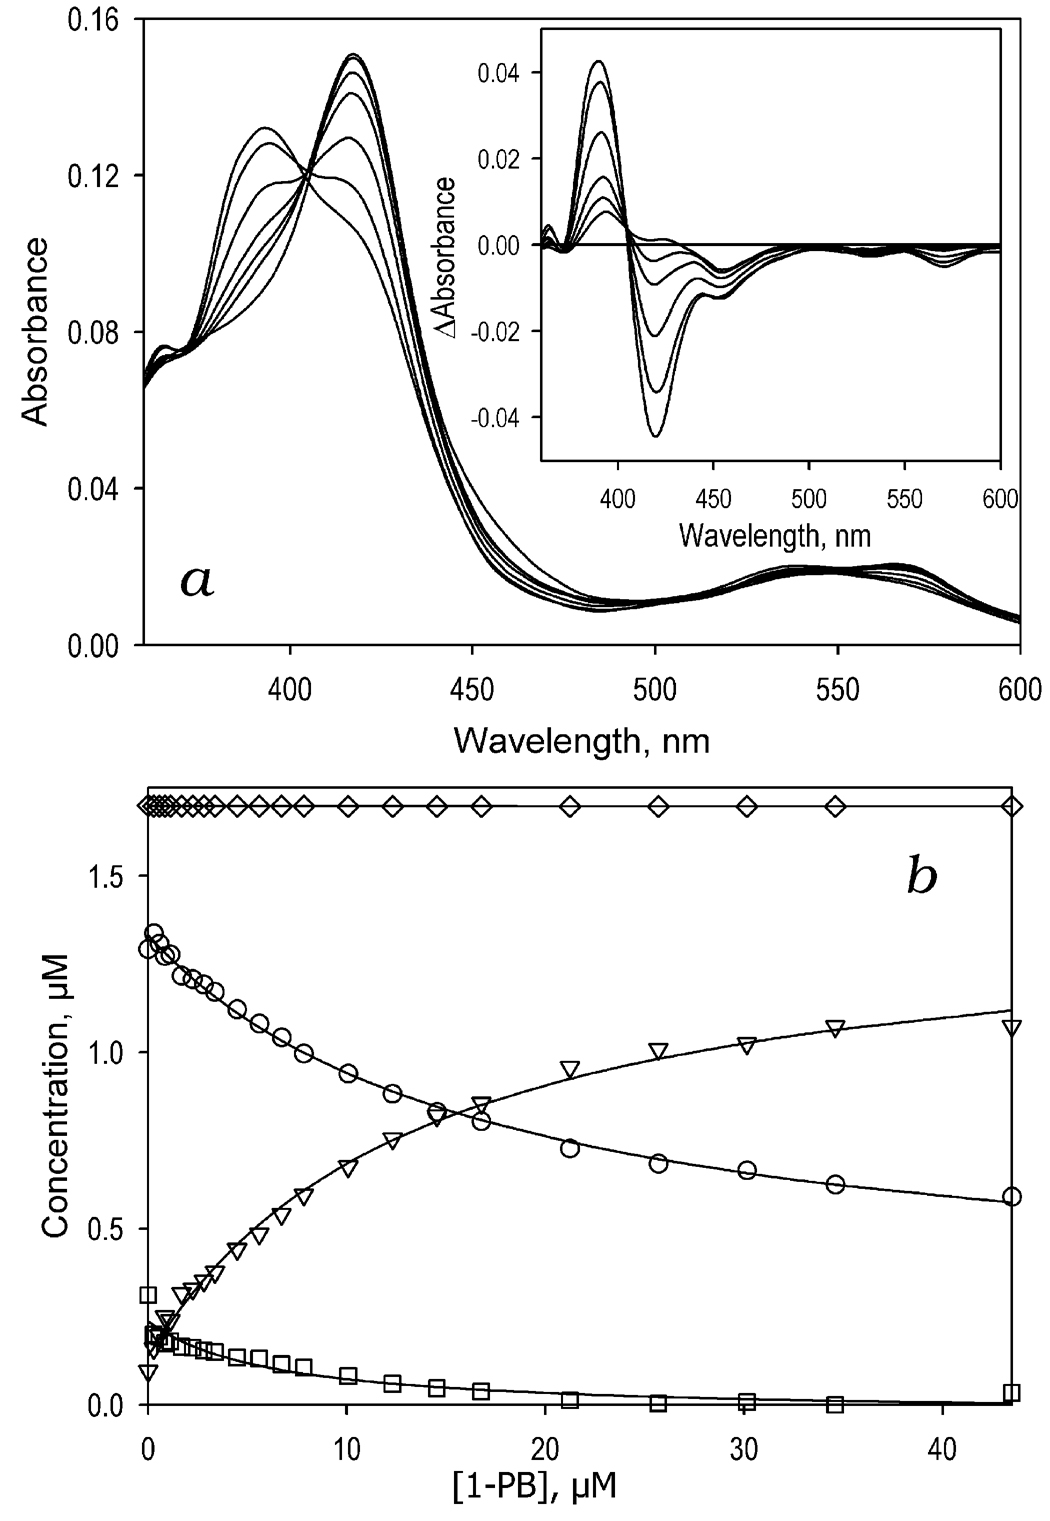
Figure 4.
Titration of CYP3A4 with 1-PB in the presence of 10 mM GSH. Panel a shows a series of spectra of 1.7 µM CYP3A4 in 0.1 M Na-Hepes buffer, pH 7.4, (25 °C) containing 10 mM GSH at no substrate added and in the presence of 0.8, 2.2, 4.5, 10, 21 and 43 µM 1-PB. The inset shows the difference spectra obtained by subtraction of the first spectrum of the series (no 1-PB added) from all subsequent spectra. Panel b illustrates the 1-PB-induced changes in the concentrations of water-coordinated low spin (circles), high-spin (inverted triangles), and the thiol(ate)-corrdinate state (squares) of the heme protein. The diamonds represent the total concentration of the enzyme.

