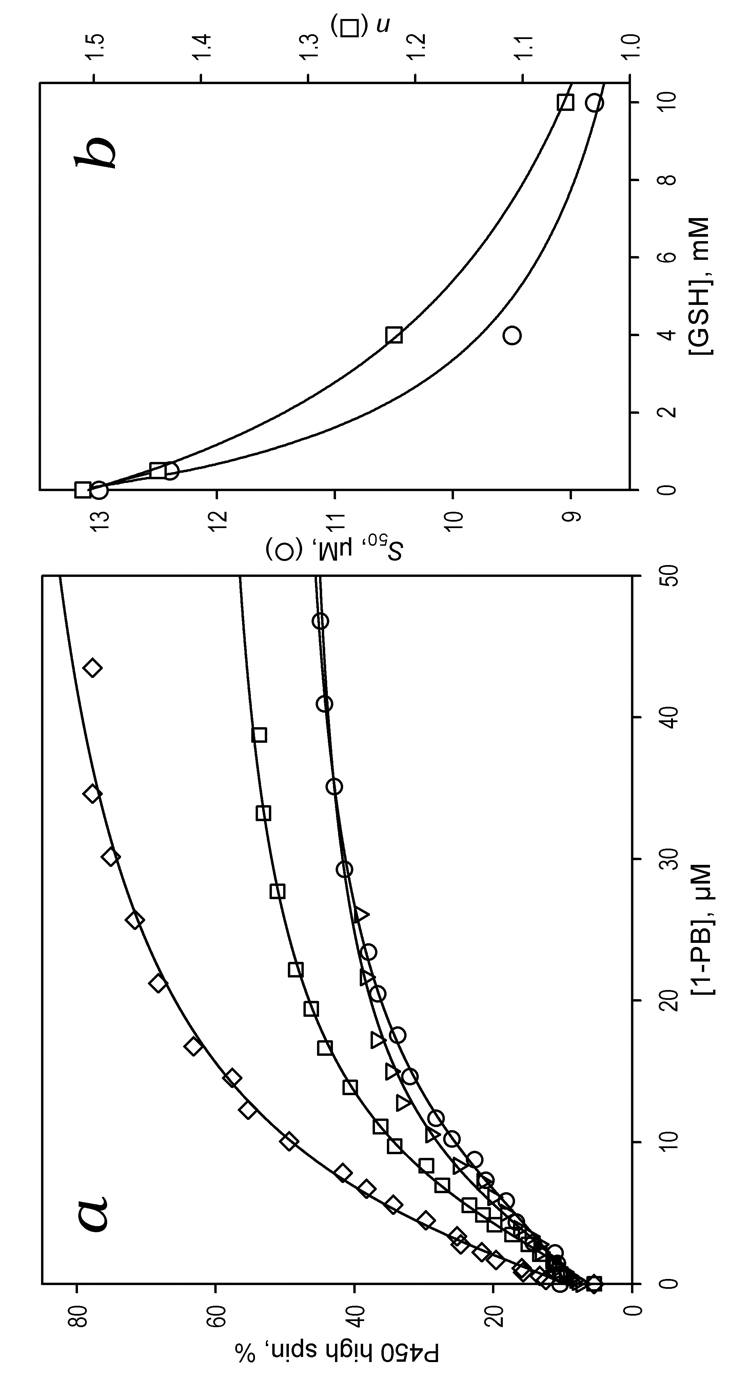
Figure 5.

Effect of GSH on 1-PB-induced spin shift in CYP3A4. Panel a shows the changes in the high spin fraction of CYP3A4 upon addition of 1-PB at no glutathione added (circles) and in the presence of 0.5 mM (inverted triangles), 4 mM (squares), and 10 mM (diamonds) GSH. The lines represent the result of fitting of the data sets to the Hill equation. Panel b shows the dependence of the S50 value (circles) and the Hill coefficient (squares) on the glutathione concentration. The points on this plot represent the averages of two to three individual measurements. The solid lines show the fitting of these data sets with a hyperbolic (Michaelis-Menten) equation with KD app values of 1.4 ± 0.9 and 1.6 ± 1.4 mM, respectively.
