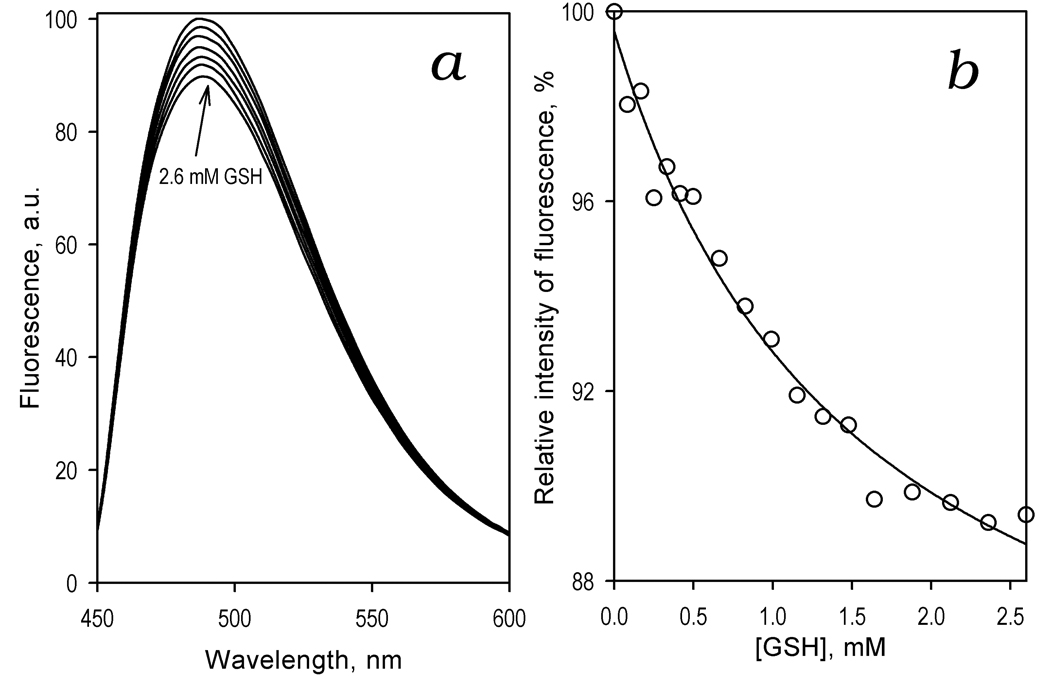
Figure 6.

Interaction of CYP3A4(C58,C64)-BADAN with GSH monitored by the changes in the fluorescence of the probe. (a) A series of emission spectra of 1.5 µM enzyme recorded at 0, 0.17, 0.33, 0.66, 1.0, 1.5, and 2.6 mM GSH. (b) Relative fluorescence intensity versus GSH concentration. The line shows the fitting of the data sets to a hyperbolic (Michaelis-Menten) equation with KDapp = 1.6 mM and the maximal amplitude of the fluorescence decrease of 17%.
