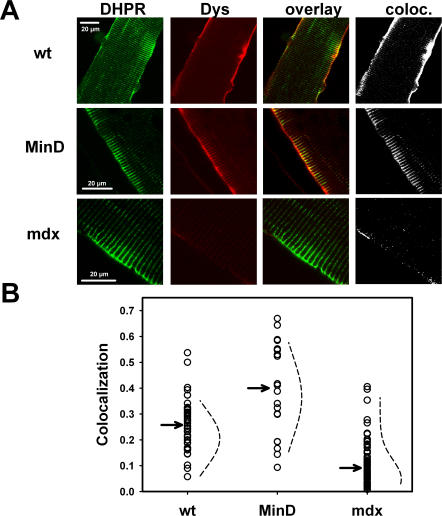
Figure 2. Colocalization of DHPR and dystrophin signals in single wt, MinD and mdx fibres.
A, representative examples of ‘in-situ’ DHPR (green) and dystrophin (Dys, red) immuno-fluorescence signals in single 10 months old wt, MinD and mdx fibres. The overlay of both DHPR and Dys signals and the colocalization images are also shown. Colocalization is substantially reduced in mdx fibres. B, Colocalization values from 20 to 75 images of each strain show smaller median values (arrows) for mdx fibres compared to wt fibres and MinD fibres. Note that a few mdx fibres show colocalization values comparable to wt fibres. The dotted lines are Gaussian fits to the data indicating that they are normally distributed in the strains.

