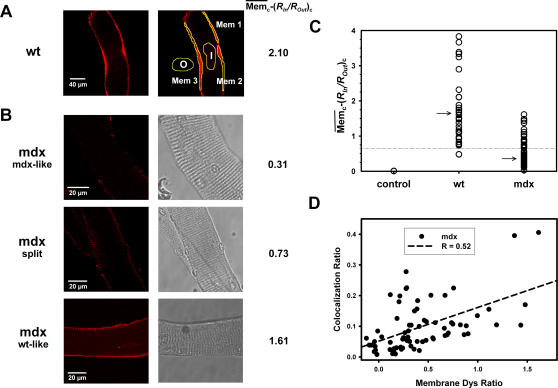
Figure 5. Quantification of membrane dystrophin signals identifies single ‘revertant’ mdx fibres.
A, Membrane dystrophin signal intensities, manually selected from three ROIs, corrected for non-specific binding and related to the corrected signal from an intracellular ROI in a 10 months old wt fibre. The individual relative membrane signal  is also shown (wt: 2.10). B, ‘in situ’ dystrophin signals from three individual representative mdx fibres (10 months). From their morphological appearance, split fibres and fibres without apparent visual morphological abnormalities were classified. In the latter group, fibres were subdivided in ‘mdx-like’ (low
  values) and ‘wt-like’ (
 values comparable to wt fibres). C, the majority of mdx fibres from aged animals were ‘mdx-like’ and a small portion ‘wt-like’ (‘revertant’) as judged from the overlap of the wt lower quartile (dashed line) and the mdx upper quartile. Arrow: median. D, the degree of colocalization correlates with membrane Dys ratios
  in aged mdx fibres.

