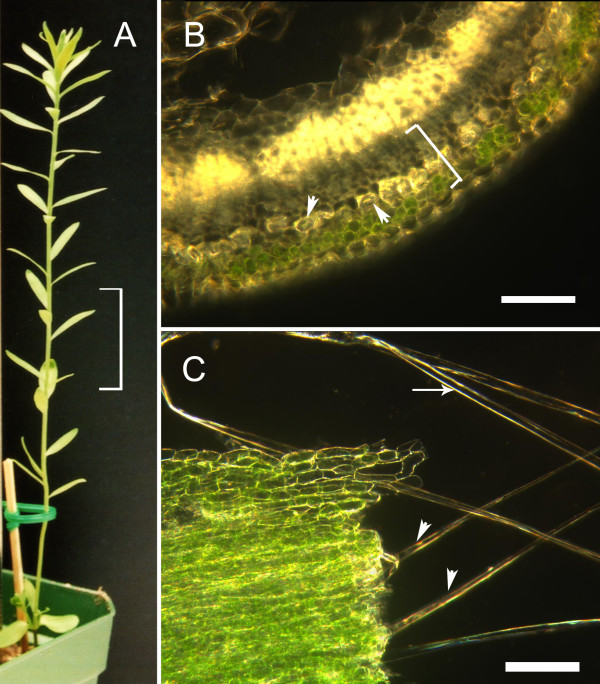
Figure 1.
A typical flax plant at the time of fibre extraction. (A) The 3 cm region of the stem from which fibres were dissected is indicated by the bracket. (B) Detail of a transverse section of fresh stem tissues at the time of harvest. This hand section was obtained from just below the snap-point to demonstrate the arrangement of tissues within the stem, i.e. transverse sectioning was not used when obtaining tissues for protein analysis. A bracket indicates the region of the cortex from which the fibre and non-fibre fractions would be obtained. The position of representative fibres within the cortex is shown by arrowheads. The scale bar is 100 μm. (C) Stem tissues during dissection. Fibres from which surrounding, non-fibres cells been partially removed are indicated by arrowheads. A fully dissected fibre, comprising a single cell is indicated by the arrow. This fibre is representative of the cells from which proteins were extracted. The scale bar is 100 μm.

