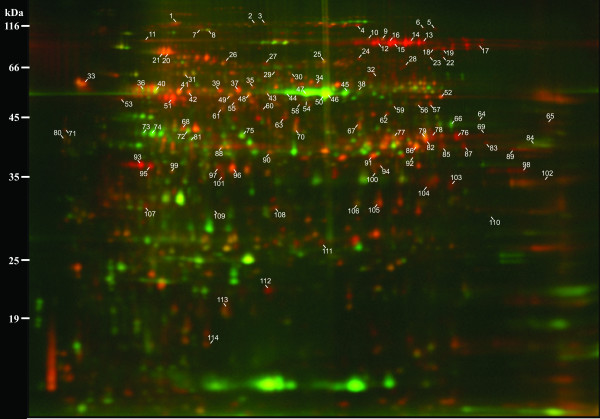
Figure 2.
Representative analytical DiGE gel. Proteins extracted from fibre and surrounding non-fibre tissues were fluorescently labeled with red and green dyes, respectively, and were mixed then separated simultaneously using 2D gel electrophoresis. Labels correspond to protein spot numbers used in Table 1 and in the text. The pH range of the first dimension separation is from 3 (left) to 10 (right).

