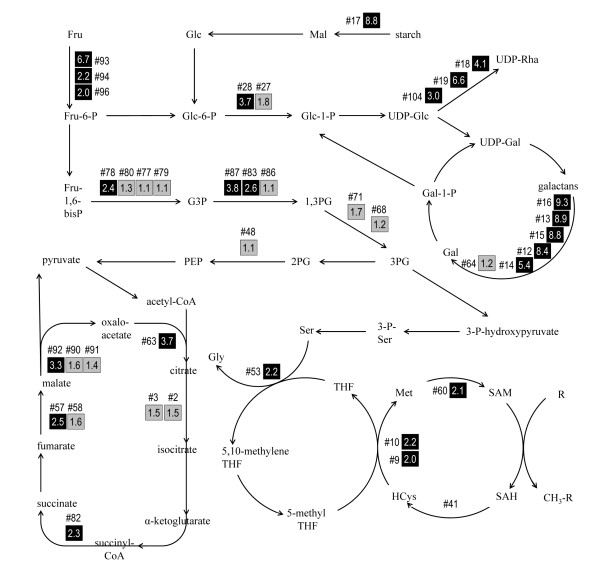
Figure 5.
Relative abundance of fibre-enriched proteins identified as enzymes in selected reactions of carbohydrate and one-carbon metabolism. Numbers following the symbol '#' are the unique spot identifiers used in Table 1 and throughout the text. Values in boxes show the fold-enrichment (i.e. signal intensity in fibres/non-fibres). Grey and black filled boxes indicate spots for which p > 0.05 and p ≤ 0.05, respectively, in a t-test of the significance of differences in intensity between fibre and non-fibre tissues. No intensity ratio is shown for #41, because multiple proteins were identified within this spot. Pathways shown are based on data from KEGG and AraCyc [37, 38]. Not all reactants or co-factors are shown. Abbreviations used in names of substrates include fructose (Fru), galactose (Gal), glucose (Glc), glyceraldehyde-3-phosphate (G3P), homocysteine (HCys), maltose (Mal), phosphoglycerate (PG), phosphoenolpyruvate (PEP), rhamnose (Rha), S-adenosyl homocysteine (SAH), tetrahydrofolate (THF).

