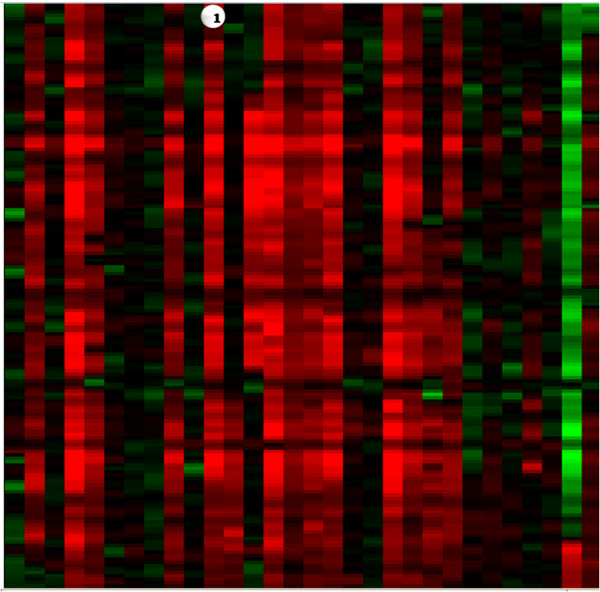
Figure 4.
Heatmap for Defining Recurring Features. Heatmap allows the user to analyze up to 100 samples and find common regions of amplification or deletion across groups of samples. (1) Each column represents a moving average heatmap of a single sample. Amplifications are shaded red and deletions are shaded green. The greater the moving average ratio the brighter the red (-) or green(+).

