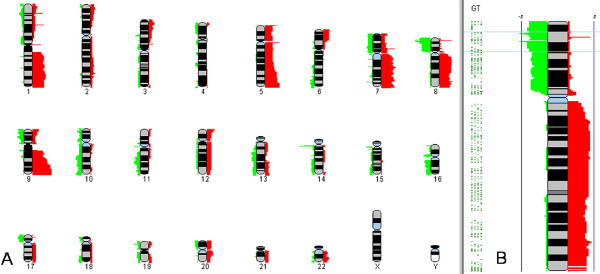
Figure 5.
Frequency Plot. The Frequency Plot can be used to analyze a group of samples and find minimal regions of amplifications or deletions. Frequency plot scoring for up to 1000 samples can be created within SeeGH or created externally and loaded into SeeGH. Once loaded each sample is stored in the SeeGH database. Amplifications are shaded red and deletions are shaded green. Left panel (A) shows genome view and right panel (B) shows the chromosome view.

