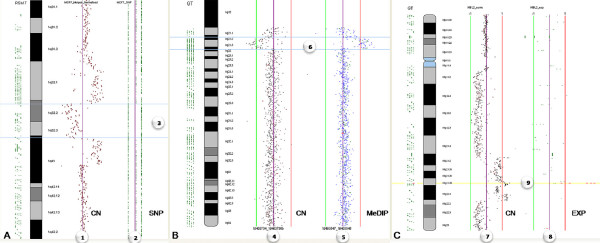
Figure 6.
Analysis of Multi-Dimensional Data: Integration of Different Types of Data. a. Integration of copy number (CN) data in the context of SNP profile for MCF7 cells. (1) SMRT array CGH profile displayed alongside (2) Affymetrix SNP array – Homozygous AA on left, Heterozygous AB in middle, Homozygous BB on right. Region between the blue lines (3) shows a copy number loss (left) on chromosome 1 associated with LOH (right). b. Integration of epigenetic and genomic profiles. (4) Methylated DNA immunoprecipitation (MeDIP) array CGH profile displayed alongside a (5) SMRT array CGH. Region between the blue lines (6) shows both hypomethylation (left) and copy number change (right). c. Integration of Array CGH and Lymphochip cDNA Gene Expression. (7) SMRT array CGH profile displayed alongside a (8) cDNA expression (EXP) profile (Lymphochip). Yellow highlighted region (9) shows a BCL2 gain and overexpression.

