
Figure 5.
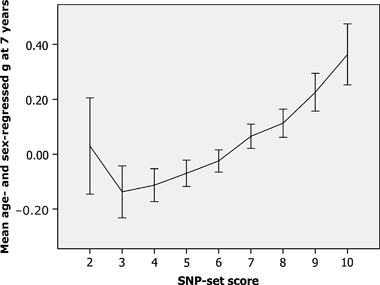
A genotype-by-phenotype plot illustrating the relationship between SNP-set scores and standardized g.The correlation between the SNP-set scores and the g scores is 0.105 (P < 0.00000003, n = 2676). The association is approximately linear, which indicates additivity of the genotypic values in the SNP set.