
Figure 2.
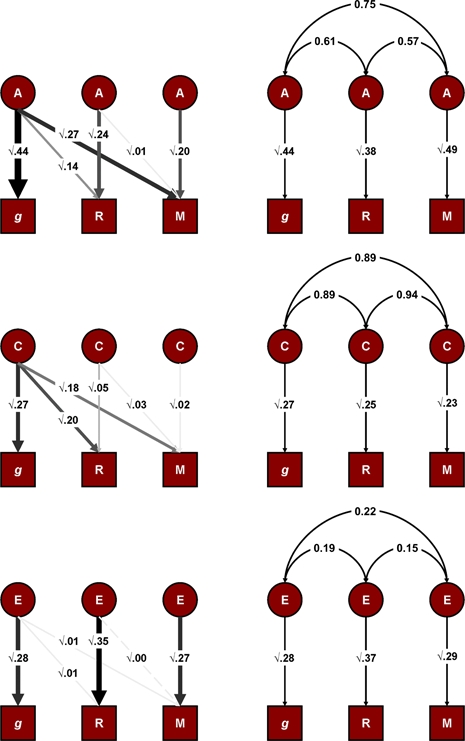
Multivariate analysis.The top panel gives the estimates for the additive genetic (A) component of the variance, with the Cholesky solution on the left and the correlated factors solution on the right. The middle panel does the same for the shared environment (C) and the bottom panel gives the estimates for non-shared environmental effects (E). In the Cholesky diagrams, line weights and intensities represent strength of association. Dotted paths can be dropped individually without a significant (P > 0.05) decrement in model fit. In the correlated factors diagrams, the curved arrows represent correlations between the latent factors. R, reading; M, mathematics.