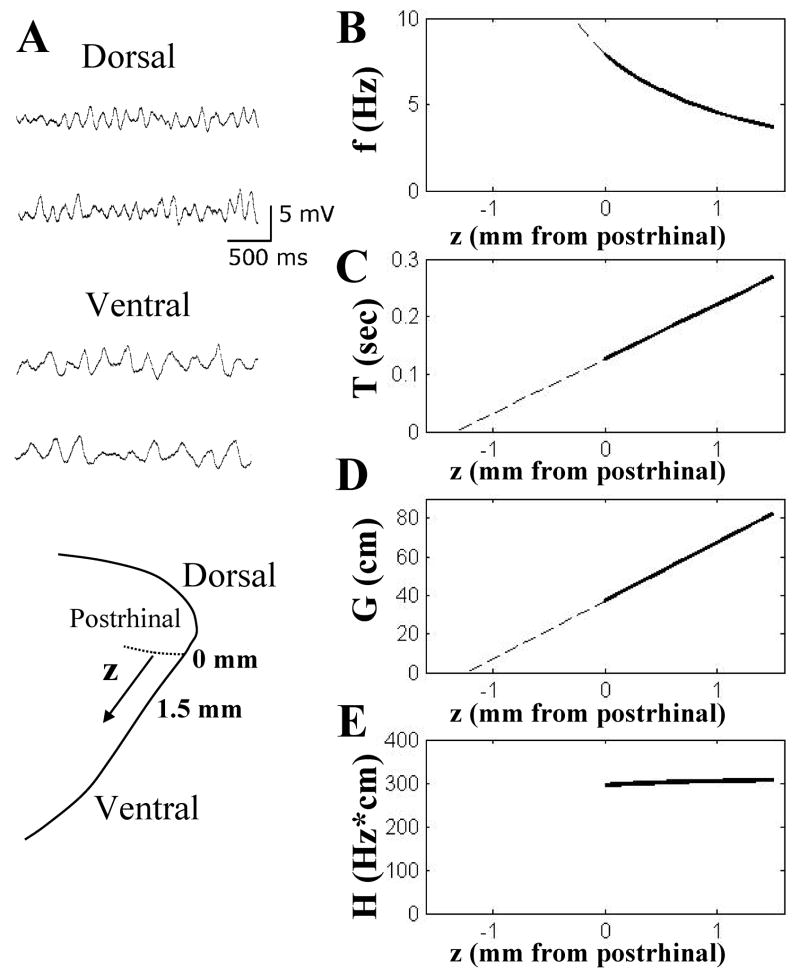
Figure 1.
A. Neurons show higher frequency of subthreshold oscillations in slices of dorsal entorhinal cortex (top traces) and lower frequency in ventral slices (bottom traces). Schematic diagram at bottom shows distance from the dorsal border with postrhinal cortex. B. Plot of change in subthreshold oscillation frequency f (in Hz) with distance from postrhinal border (z, in mm) based on reciprocal of data shown in 1C. C. Plot of period (T, in sec) of subthreshold oscillations relative to distance from postrhinal border (z, in mm) directly based on the equation from linear fit of data (Giocomo et al., 2007). Dashed line shows extrapolation beyond border. D. Plot of grid cell field spacing (G, in cm) relative to distance from postrhinal border (z, in mm) based on equation from linear fit of previously published data (Sargolini et al., 2006). E. Plot of scaling value H (in Hz-cm) based on product of f and G. Note that this value stays near 300 Hz-cm.

