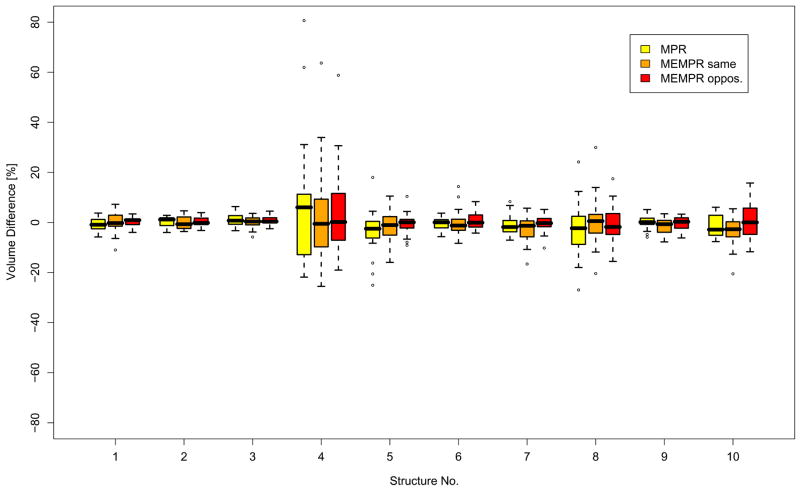
Figure 10.
Volume differences between brain structures scanned between the two scanners, averaged across subjects, for three sequence types. Structure numbers follow Figure 9 and are for the left hemisphere. Left and right hemisphere results were similar.

