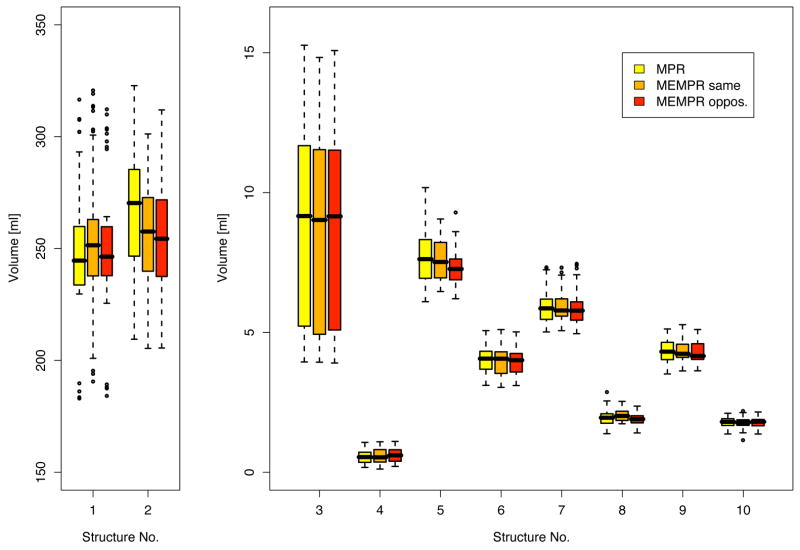
Figure 9.
Volumes of brain structures averaged across subjects and scanners for three sequence types. 1=cerebral white matter, 2=cerebral cortex, 3=lateral ventricle, 4=inferior lateral ventricle, 5=thalamus proper, 6=caudate, 7=putamen, 8=pallidum, 9=hippocampus, 10=amygdala. Volumes are shown for left hemisphere – right hemisphere was similar.

