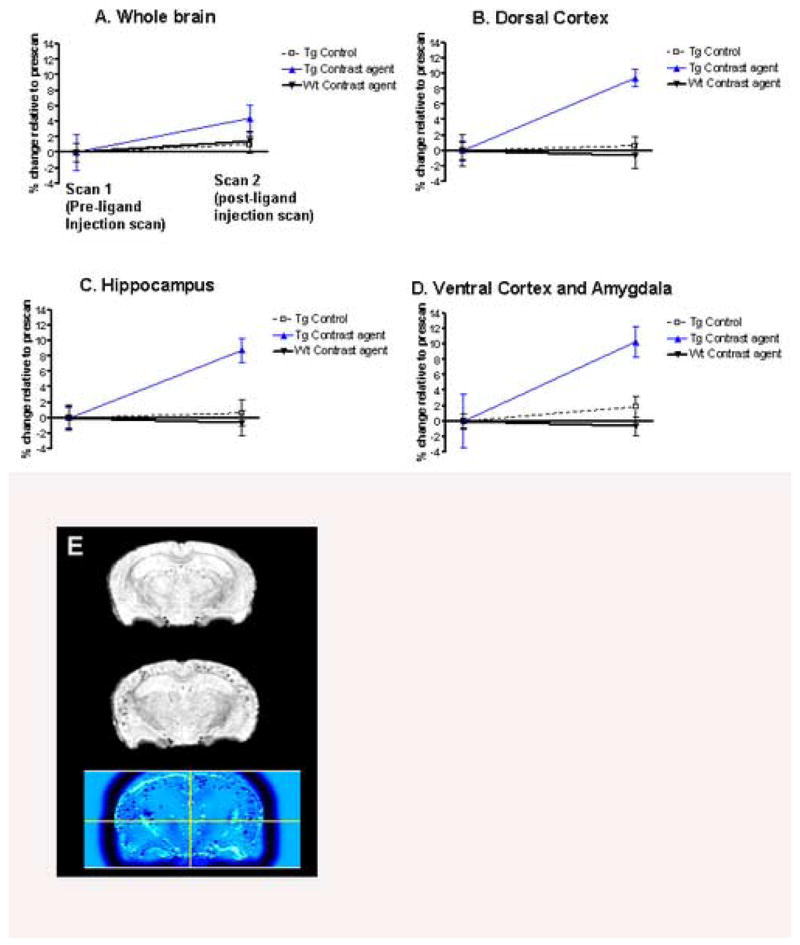
Figure 5. Quantitative voxel based analysis of the in vivo MRI scans of AD model mice.

(A-D) The first scan (pre-ligand injection scan) was always in naïve animals (no injection), transgenic (Tg) (n=11) or wild-type (n=10). The second scan (Scan 2) was performed: 1) In Tg controls that were imaged two weeks earlier with no ligand injection (n=8); 2) in Tg controls injected with Gd free DTPA-K6Aβ1–30 (n=3); 3) In Tg mice injected with Gd-DTPA-K6Aβ1–30 (n=9), and; 4) in wild-type controls injected with Gd-DTPA-K6Aβ1–30 (n=5) or Gd-DTPA (Magnevist; n=5). Significant differences were observed in the AD transgenic group injected with Gd-DTPA-K6Aβ1–30 (Tg Contrast ligand) compared to Tg controls. This effect was observed within the whole brain (A; p<0.01), dorsal cortex (B; p<0.001), hippocampus (C; p<0.001), and the ventral cortex and amygdala (D; p=0.002). When the animals were injected, Scan 2 was performed 4–6 hours later. On non-parametric analysis, no differences were found between wild-type mice injected with different tracers so those were combined. The dorsal cortex encompasses the dorsal- and dorsolateral cortex (retrosplenial- and parietal association cortex). The ventral cortex contains the ventral- and ventrolateral cortex (entorhinal-, perirhinal- and pyriform cortex). In the graphs, the data is presented as percentage change (± SEM) in signal intensity relative to the prescans within the same group.
(E) Shows the co-registered and spatially normalized pre-ligand (top) and Gd-DTPA-K6Aβ1–30 post-ligand injection (middle) scans of one Tg mouse. The resulting difference image is shown on the bottom and was generated with SPM (see methods) as the mathematical subtraction of the post-ligand from the pre-ligand MRI scans. Non-brain voxels were excluded from the analysis by applying a brain mask (see methods). The difference image is displayed using a blue-black color-coded scale to highlight the amyloid-plaques load in the Gd-DTPA-K6Aβ1–30 injection scan as compared to the pre-injection scan. The cross-bars in the bottom image are set at the origin of the normalized MRI scan.
