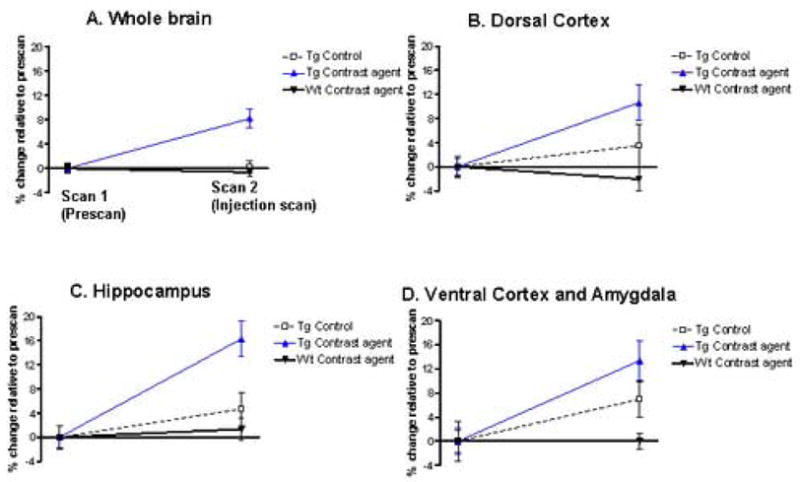
Figure 6. Quantitative voxel based analysis on the in vivo MRI scans of AD model mice using the cerebellum as a confounding covariate.

The mice analyzed are the same as those described in Figure 5. In that figure, global intensity was used as a confounding covariate which can lead to underestimation of differences between pre- and post-ligand injection scans. Because the cerebellum is not prone to Aβ deposition, the images were reanalyzed with the cerebellum as the reference region. This was done by sampling values in anterior cerebellar vermis on the coronal plane of each scan by using a standardized two dimensional spherical region of interest with a radius of 300 μm.
By using the cerebellum as a covariate, the analyses confirmed that significant loss of signal intensity on the post-ligand injection MRI as compared to the pre-ligand injection MRI was found exclusively for the group of transgenic mice injected with Gd-DTPA-K6Aβ1–30, reflecting amyloid plaques. In cross-section, there were no differences in the pre-ligand MRI scans across groups in any regions (p’s>0.1). Post-ligand injection MRI scans showed group effects for the whole brain (A; F(2,25)=10.31, p=0.001), that were maximized in the dorsal- and dorsolateral cortex (B; F(2,25)=4.92, p=0.016), hippocampus (C; F(2,25)=8.35, p=0.002), and ventral- and ventrolateral cortex (D; F(2,25)=5.98, p=0.008). In these regions, post-hoc analyses showed significantly greater amyloid burden for the group of transgenic mice injected with Gd-DTPA-K6Aβ1–30 as compared to both other groups (p’s<0.01), and no differences between wild-type mice and transgenic mice imaged without contrast agent. By contrasting the pre-ligand to the post-ligand injection MRI scans of the transgenic mice injected with DTPA-K6Aβ1–30, regional differences were 11% in the dorsal- and dorsolateral cortex (t(8)=3.01, p=0.01), 16% in the hippocampus (t(8)=10.8, p<0.001), 13% in the ventral- and ventrolateral cortex (t(8)=4.31, p=0.002).
No group differences were found on Mann-Whitney non-parametric analysis contrasting wild-type mice injected with different ligands (p’s>0.1).
