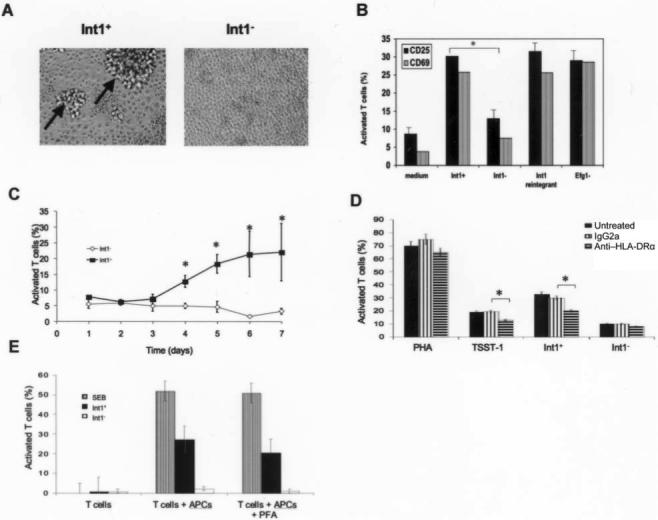
Figure 2.

A, Foci of peripheral blood mononuclear cells (arrows) on the fourth day of coculture with Int1-positive (Int1+) Candida albicans blastospores or Int1-negative (Int1−) C. albicans blastospores. B, Peripheral blood mononuclear cell positivity for CD25 or CD69 after coculture with Int1+ C. albicans strain (DAY286), Int1− C. albicans strain (VBIDM2), Int1+ reintegrant (VBIDM6−2R), or the Efg1 null mutant. *P < .002 (n = 6 experiments). C, Activation of T cells from 5 healthy donors in response to Int1+ (CAF2) or Int1-negative (CAG3) C. albicans blastospores. Data are mean values ± 2 SDs. *P < .02. D, Effects of no treatment, IgG2a control antibody, or anti–HLA-DRα antibody on T cell activation evoked by phytohemagglutinin (PHA), toxic shock toxin (TSST-1), Int1+ C. albicans blastospores (CAF2), or Int1-negative C. albicans blastospores (CAG3). Data are mean values ±2 SDs. *P < .04 (n = 3 experiments). E, T cell activation induced by stimulation of T lymphocytes alone, T lymphocytes plus antigen-presenting cells, or T lymphocytes plus paraformaldehyde-fixed antigen-presenting cells after stimulation with staphylococcal enterotoxin B (SEB), Int1+ C. albicans, or Int1-negative C. albicans (n = 2 experiments).
