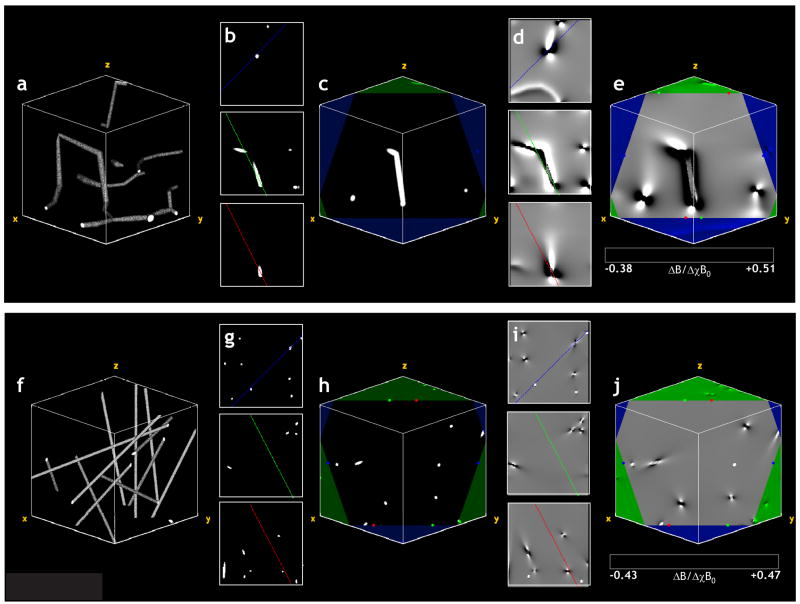
Fig 6.
(a) 3D volume rendering of the section of the cerebrocortical capillary network employed in the GE and SE MR signal simulations. (b) Three orthogonal center planes of the volume in (a) with colored lines indicating the intersection of the displayed slice and the three orthogonal center planes of the volume. (c) A slice through the volume in (a) with the borders of the volume displayed in green. The red, green and blue colored markers indicate the start and end positions of the lines in the planar views shown in (b). (d) Three orthogonal center planes of the normalized magnetic field perturbation map corresponding to the capillary network in (a). (e) A slice through the magnetic field perturbation map corresponding to the slice in (c). One can clearly visualize the dipolar field pattern around each capillary. (f) 3D volume rendering of the ensemble of random cylinders employed in the GE and SE MR signal simulations, with its physical dimensions scaled to match those of the cerebrocortical network (i.e. fractional volume ~0.5%, average vessel radius=1.8μm). (g) Three orthogonal center planes of the volume in (f) with colored lines indicating the intersection of the displayed slice and the three orthogonal center planes of the volume. (h) A slice through the volume in (f) with the borders of the volume displayed in green. The red, green and blue colored markers indicate the start and end positions of the lines in the planar views shown in (g). (i) Three orthogonal center planes of the normalized magnetic field perturbation map corresponding to the cylinders in (f). (j) A slice through the magnetic field perturbation map corresponding to the slice in (c). One can visualize the dipolar field pattern around each cylinder, and see differences in 3D-spatial variations of the magnetic field perturbations between geometries (e) and (f).

