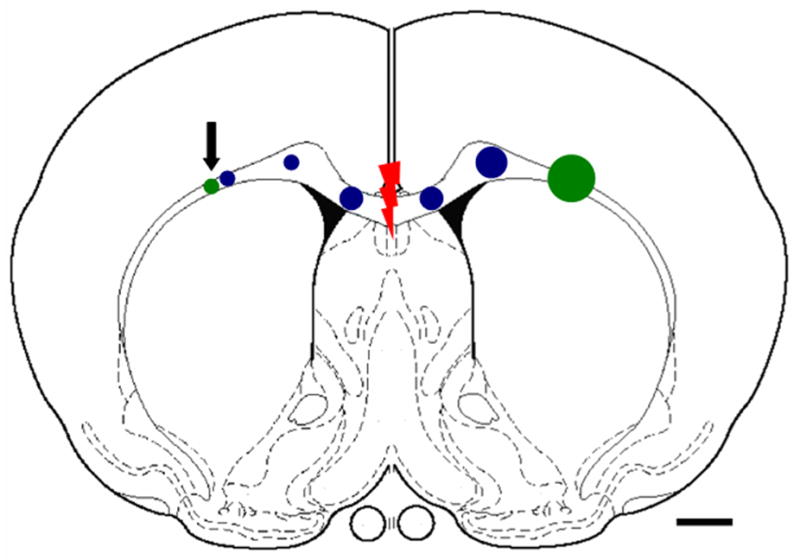
Figure 1.

Schematic diagram showing locations for adenovirus injections. Green = Ad-NGF (transplant site at left w/arrow, target at right); Blue = a pathway along the corpus callosum with Ad-GFP, Ad-NGF or Ad-NGF/FGF. Red indicates lesion site. Larger circles indicate more virus injected. Scale bar =1mm.
